 Dice rolling, finding a parking space, winning at cards; These are just some situations where you might want to find the odds of an event happening. You can even use probability to increase your odds of winning scratch off lottery tickets! If you want to know how to find probability, you first have to figure out what kind of question you have. For example, how you find the odds of an event happening is different from finding the odds of group members choosing the same thing.
Some probabilities are easy to identify, like finding dice rolling probabilities or picking from a deck of cards.
Questions that involve the binomial theorem are also easy to identify. In these types of experiment, the only possible outcomes of an event are “Success” or “Failure”: like yes/no, heads/tails or black/white.
Other question types you might come across involve people, like:
Events
Do you want to find the probability of a simple event happening? Like it raining, or finding a parking space downtown? See:
Probability of a simple event happening.
On the other hand, if you want the exact opposite, see:
How to find out the probability of an event NOT happening.
Is your question about one event happening given another event? Like the odds of finding a parking space, given that it’s game day, or finding a certain popular toy on Black Friday? If so, check out:
Frequency Distributions
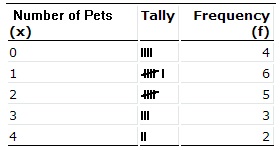
Do you have a frequency distribution to work with? Or are you able to make a frequency distribution table with your given data? For example, you have x number of items with a certain traits. Probability frequency distribution.
Introduction to Probability: How-to Articles and Videos.
- Probability in Real Life
- Permutations and Combinations: How to Solve Problems
- Probability Problems: Solve them the easy way!
- Probability of a and b.
- Total Probability Rule.
- Bayes Theorem Problems: Easy Solution Steps.
- Prior Probability (including Uninformative and Conjugate).
- How to Make a Probability Distribution from data.
- How to find the Probability of Selecting a Person from a Group or Committee.
- How to find the Probability of an Event NOT Happening.
- Probability Frequency Distribution.
- How to Find the Probability of a Simple Event Happening.
- Random Event: Probability Given a Percentage.
- How to Find the Probability of Group Members Choosing the Same Thing.
- How to find the Probability of Two Dependent Events Occurring Together.
- How to find the Probability of an Event Occurring, Given Another Event.
- How to use a Probability Tree (Decision Tree) to Calculate Odds.
- How to find the Probability of Drawing a Card from a Deck.
- How to Figure out if Something is a Mutually Exclusive Event.
- How to Tell the Difference Between Dependent and Independent Events.
- Probability: Dice Rolling.
- How to Draw a Venn diagram.
- How to Create an Euler Diagram.
- 5 choose 3: how to solve combinations.
- How to use the fundamental counting principle.
- How to find expected value for a discrete random variable.
Introduction to Probability: Definitions
- Axiomatic Probability.
- Benford’s Law
- What is a Binomial Experiment?
- Base Rates and the Base Rate Fallacy
- Brier Scores
- Collectively Exhaustive
- What are Combinations?
- Complementary events.
- Conditional Expectation
- What is Conditional Relative Frequency?
- Countable Additivity
- Empty Set
- Epistemic Probability
- Event spaces.
- What is Experimental Probability?
- Hoeffding’s Inequality
- Impossible Event
- Interpretations of Probability
- Joint Probability Distributions.
- Limiting Distribution.
- Maximum Likelihood Estimation
- Memoryless Property.
- Monte Carlo Method.
- Monty Hall Problem
- What is a Mutually Exclusive Event?
- What is a Mutually Inclusive Events?
- Mutually Independent and Pairwise Independent.
- What is the Multiplication Rule?
- Nash Equilibrium
- Nonempty Set
- Normal Probability Practice Problems.
- What is a Normal Probability Plot?
- Objective Probability
- What is the Odds Ratio?
- Predictive Analytics
- What is a Probability Distribution Table?
- Probability Measure
- What is a Probability Space?
- Probability Vectors
- What are Sample spaces?
- Stochastic Models.
- What is Subjective Probability?
- What is Theoretical Probability?
- What is an Urn Model?
- Zero-Sum Game Definition
Calculators.
Probability Formulas / Probability Rules
One of the most uncomfortable things that students don’t like about formulas is the lack of them in probability and statistics. There are a few staples, including some must-know notation:
Probability Range
0 ≤ P(A) ≤ 1
This states that the probability of an event is somewhere between zero and 100% (as a decimal, that’s 0 and 1). You’ll want to remember this rule when adding or multiplying probabilities of events. If your answer is over 100%, that’s a clue you might have done something wrong.
Rule of Complementary Events
P(AC) + P(A) = 1
Complementary events happen when there are only two outcomes, like flipping a coin. Rolling a die to see if you would get six is also complementary; the only two outcomes are getting a six (a 1/6 chance) or not getting a six (5/6 chance). The two probabilities must add up to 1.
You may also see this formula written like this:
p(A) + p(A’) = 1
which can be rearranged algebraically to read:
p(A’) = 1 – p(A).
All three formulas are equivalent: which terminology (A’ or Ac) is used is up to the textbook author and teacher. Personally, I prefer A’, which I call “not A.” The probability of “not A”, I think, is easier to comprehend than “the complement” (either an event happens, or it does not happen).
Addition Rule
P(A∪B) = P(A) + P(B) – P(A∩B)
where ∪ is the union and ∩ is the intersection.
What this is saying (in English!) is the probability of event A OR event B happening (or both at the same time) is:
- The probability of event A happening on its own,
- Plus the probability of event B happening on its own,
- Plus the probability of both events happening at the same time.
If you have mutually exclusive events, then P(A∩B) can’t happen (the events can’t happen together), so the formula becomes:
P(A∪B) = P(A)+P(B)- 0 = P(A)+P(B)
Disjoint Events
Events A and B are disjoint if:
P(A∩B) = 0
This is just another way of saying the events are mutually exclusive. They cannot happen at the same time.
A Related formula is P((A∪B)c) or, equivalently ((A∪B)‘). In English, this says “not the union.” To solve this, figure out the union and take the result away from 1 (because the probability of the events happening or not happening must add up to 1).
Conditional Probability
P(A|B) = P(A∩B) / P(B)
The “|” symbol means “given that”. In other words, the probability of event B happening, given that event A happens. For examples of how to use the formula, see: conditional probability.
Bayes Formula
P(A|B) = P(B|A) · P(A) / P(B)
Bayes’ theorem is a way to figure out conditional probability, although it is slightly more nuanced. In a nutshell, it gives you the actual probability of an event given information about tests. For example, what is the probability you have cancer if your medical test is positive (answer = a lot lower than you think). For some examples, see: Bayes Theorem Examples and Posterior Distributions / Posterior Probabilities.
Independent Events
Events A and B are independent if one of them doesn’t affect the probability of the other. Events are also said to be independent if the following equation holds true.
P(A∩B) = P(A) · P(B).
This equation is derived from the multiplication rule, which says that P(A∩B) = P(A) * P(B|A). As we know that P(B|A) = P(B) for independent events, we can substitute P(B|A) for P(B), giving us the formula.
Some Notes on Probability Rules
Statistics is about chance and ballparking, not absolutes and the “right answer.” Just look up any Gallup poll—they are rarely more than 90% confident that they have the “right answer.” There are techniques you can use to figure out odds (like multiplying two probabilities together, or adding them). However, other than perhaps the binomial distribution table and the formulas above (which in real life, aren’t used that much), there aren’t really any probability formulas you can easily apply. You have to revert back to that old elementary school staple, logic (you remember it…it was there right before they started standardized testing the logic out of you).
The three Rules of probability formulas:
- There are no rules (well, very few, except those listed above).
- Use logic, not equations.
- There are many, many different ways to get to the answer — none of which really use formulas.
Here’s a question that arrived in my inbox this morning that tackles probabilities:
“If you were trying to collect 6 baseball cards that came in packets of cheese puffs, assuming they are distributed evenly how many packets of cheese puffs would you expect to buy before you have all 6 cards?”
Step 1 to solving this problem is realizing you can’t look up the answer in a table. In order to solve it, you have to think like a kid.
Card# 1:You’re 8-years-old again, walking into a store with enough money to buy one bag of cheese puffs. You hope to collect all 5 of the baseball cards but you don’t have any yet. What are the odds you buy a bag and get a card you want?
The answer, of course, is 100%. Buy your first bag, and you have 100% chance that there’s a card in it that you want.
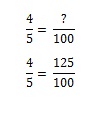
Card# 2: Now it gets a little trickier. You return to the store to get card#2. But as you already got card #1, Mickey Mantle. You don’t want him again, but there’s a 1/5 chance you might get him (and therefore a 4/5 chance you won’t). How many bags of cheese puffs will you have to buy to get card #2 becomes a ratio problem. You could figure it out in your head, but if you want to model it mathematically you have to set up the equation. If one bag of cheese puffs gives you a 80% chance of getting the card you want, how many bags do you need to buy to get a 100% chance?
Card# 3:The odds start to get tougher. You have a 60% chance of getting the third baseball card, and you’ll have to buy 1.667 bags to get that third card.
Card# 4:The odds start to get a little dismal. You have a 40% chance of getting the fourth baseball card, and you’ll have to buy 2.5 bags to get that third card.
Card# 5:The odds are against you. You have a 20% chance of getting the last card, and you’ll have to buy 5 bags to get that third card.
So the total amount of bags you’ll have to buy equals:
1 + 1.25 + 1.667 + 2.5 + 5
But wait! (And here’s where a little logic comes in). You can’t go into a store and buy 1.25 bags of cheese puffs, so you’ll have to round up. The equation becomes:
1 + 2 + 2 + 3 + 5 = 13 bags.
One important point for formulas: remember that nothing is absolute. I am reasonably confident that if you purchased 13 bags of cheese puffs and assuming the cards are evenly distributed, that you would get all 5 cards. But…probability is about chance, and it could be just your bad luck to get the same card 10 times in a row (I remember that happening to me as a kid). But there could be another explanation for your “bad luck,” and that is that companies want you to buy as many bags as possible, so they will try to make the odds work in their favor. Even if the cards are evenly distributed, the company could ship bags with cards #1, #2, and #3 to one store (therefore reeling you in by getting you to collect more than half the cards) and #4 and #5 to another store.
What other ways can you think of that manufacturers might turn the odds in their favor?
Probability of a Group Choosing the Same Thing
Probability questions can be broken down into different types. When you are asked to find the probability of a group choosing the same thing, you’re considering the actions of random members of a group (it could be as small as a committee or it could be as large as the population of the U.S.).
These probability questions give you a group, and ask you to calculate the probability of an event occurring for a certain number of random members within that group.
Probability of a Group Choosing the Same Thing : Steps
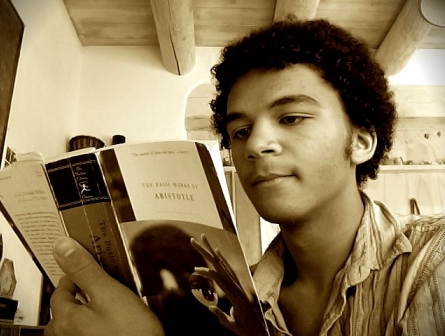
Sample Problem: There are 200 people at a book fair. 159 of them will buy at least one book. If you survey 5 random people coming out of the door, what is the probability they all will have purchased at least one book?
Step 1: Convert the data in the question to a fraction. For example, the phrase “159 people out of 200” can be converted to: 159/200.
Step 2: Multiply the fraction by itself. Repeat for however many random items (i.e. people) are chosen. In our example, we have 5 people surveyed, so we want:
159/200 x 159/200 x 159/200 x 159/200 x 159/200 = 0.3176
That’s how to find the Probability of a Group Choosing the Same Thing!
Tip: It may be easier to convert the fraction into a decimal before multiplying. In this case, 159/200 = 0.795.
What is “A Union B”?
A Union B means that A happens or B happens (or perhaps both happens). These could be events, objects, or just about anything else. For example:
A person buys a scratch off lottery ticket. Event A could be “wins up to $10” and event B could be “wins $10 or more”. The possibility of winning anything at all (i.e. the set of all possibilities) is called the union.
An asteroid on its way to Earth might hit the Earth (A) or miss it (B). The set of possibilities “hit” or “miss” is the union.
A box of chocolates might be milk (A), dark (B) or both. The union is {milk, dark, both}.
How to Represent A Union B Mathematically
Unions are represented mathematically by a cup symbol (∪). Let’s say you wanted to represent whether a list of “black objects” OR “white objects” can be found in a gift shop. The list contains Shells, Dog Figurines, Ceramics, Hats, Jewelry, Paintings, Face Cream and Dresses. You would write the union as:
Black ∪ White = {Shells, Dog Figurines, Ceramics, Hats, Jewelry, Paintings, Face Cream, Dresses, Coal, Snow}.
All of the listed items are, together, a union: any particular object could be black, white, or perhaps could be both at the same time (a figurine of a Dalmatian for example would be both black and white).
You can represent A Union B with a Venn diagram. For example, this Venn diagram shows A Union B of household objects divided into two categories: A (electronic) and B (non-electronic).
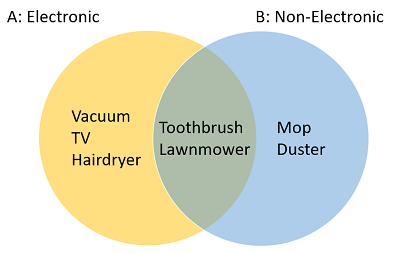
You may notice that there’s some overlap on the diagram. Toothbrushes and lawnmowers can be electronic (or manual). This overlap is called an intersection.
Check out our YouTube channel for more stats help and tips! We’ve got videos for the most common problems you’ll be likely to come across. Plus videos for using Excel in stats > everything from making basic bar graphs to solving complex data analysis problems.