Probability and Statistics > Probability > How to Draw a Venn Diagram
Contents:
- Basic Diagram.
- Intersection: Draw a Venn Diagram of A ∩ B.
- Union: Draw a Venn Diagram for A ∪ B.
- Venn diagram template for Word.
Venn diagrams are a way to visualize relationships between groups of objects. They are often confused with Euler diagrams. While both have circles, Venn diagrams show the whole of a set while Euler diagrams can show parts of a set. Venn diagrams can have unlimited circles, but more than three becomes extremely complicated so you’ll usually see just two or three circles in a Venn diagram drawing.
Draw a Basic Venn Diagram.
Need help with a homework question? Check out our tutoring page!
Example question: Draw a Venn diagram to show categories of “indoor” and “outdoor” for the following pets:
Cat, Goat, Rabbit, Tortoise, Hamster, Fish, Horse, Parrot.
Step 1: Categorize your items (in this case, pets):
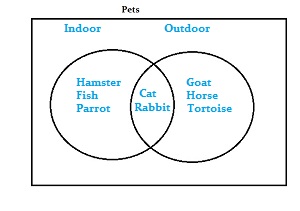
Indoor pets: Hamster, Fish, Parrot.
Outdoor pets: Goat, Tortoise, Horse.
Both categories (indoor and outdoor): Cat, Rabbit.
Step 2: Draw a rectangle and label it. For this sample question, label the rectangle “Pets.”
Step 3: Draw two or three circles according to how many categories you have. There are two categories in the sample question: “indoor pets” and “outdoor pets”, so draw two circles. Make sure the circles overlap.
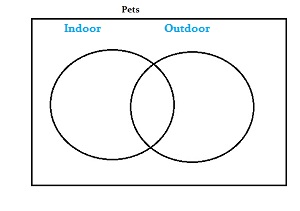
Step 4: Write your items in the relevant circle. If items fit both categories, write those where the circles overlap (the “intersection“).
 .
.
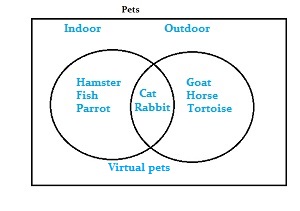
Tip: If you had a pet that doesn’t fit a category (a virtual pet, for example, might not fit either category), write it within the rectangle but outside the circles.
Back to Top
Draw a Venn Diagram of A ∩ B: Overview
An Intersection (∩) in Venn diagrams is when items appear in both categories presented (not one or the other). The intersection is written as A ∩ B where A is one category and B is a second category. The ∩ means “intersection,” which in the example above were the pets that were both indoor and outdoor : cats and rabbits. It’s written as:
Indoor ∩ Outdoor = {cats,rabbits}.
Which way does the ∪ go? An easy way to remember is that the union is the ∪ (so by default, the intersection is the other one!).
Draw a Venn Diagram of A ∩ B: Steps
Example question: Draw a Venn Diagram of A ∩ B (Intersection) of “black things” and “white things”:
Coal, Cats, Tar, Onyx, Snow, milk, shaving cream, hair
Step 1: Categorize your items (in this case, “things that are black” and “things that are white”):
Black: Coal, Tar, Onyx
White: Snow, Milk, Shaving Cream
Can be both: Cats, hair
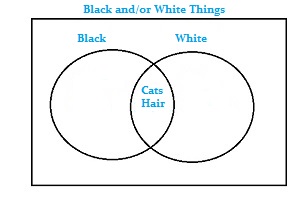
Step 2: Draw a rectangle and label it. For this sample question, label the rectangle “Black and/or white things.”
Step 3: Draw two or three circles according to how many categories you have. There are two categories in the sample question: “black” and “white”, so draw two circles. Make sure the circles overlap.
Step 4: Write the items that are in the intersection {cats, hair] in the space where the circles overlap.
That’s it!
Back to Top
Draw a Venn Diagram for A ∪ B : Overview
A Union (∪) is when items are in some or all categories. For example, let’s say you wanted to make a Venn diagram for categories of “black things” and “white things”. Your list of items is: Coal, Cats, Tar, Onyx, Snow, milk, shaving cream, and hair.
A union is written (the “mathy way”) as:
Black ∪ White = {Coal, Cats, Tar, Onyx, Snow, milk, shaving cream, hair}. The items that are a union (black, white, or could be both) are all of the items listed: Coal, Cats, Tar, Onyx, Snow, milk, shaving cream, hair.
But how would you put that in a diagram? The answer is to use circles to display each category; the circles overlap where the categories overlap.
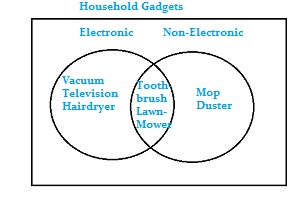
Sample problem: Draw a Venn Diagram for A ∪ B (Union) for household gadgets that are electronic and/or non-electronic:
Vacuum, Mop, Television, Duster, Toothbrush, Hairdryer, Lawn Mower.
Step 1: Categorize your items (in this case, household gadgets):
Electronic: Vacuum, Television, Hairdryer.
Non-Electronic: Mop, Duster.
Both: Toothbrush, Lawn Mower.
Step 2: Draw a rectangle and label it. For this sample problem, label it “Household gadgets.”
Step 3: Draw circles according to how many categories you have. There are two categories in the sample problem: “electronic” and “non-electronic”, so draw two circles. Make sure the circles overlap.
Step 4: Write the items in the relevant circle. If items fit both categories, write those where the circles overlap.
That’s it!
Free Download: Venn Diagram Templates.
Click the link below to download a free Word Document with three different Venn diagram templates. Included are two, three and four circles. The document is editable, so you can type in the information before printing it out. Or, print as-is and fill in the circles with paper or pencil.
Click here for the VENN DIAGRAM TEMPLATE DOWNLOAD (Microsoft Word).
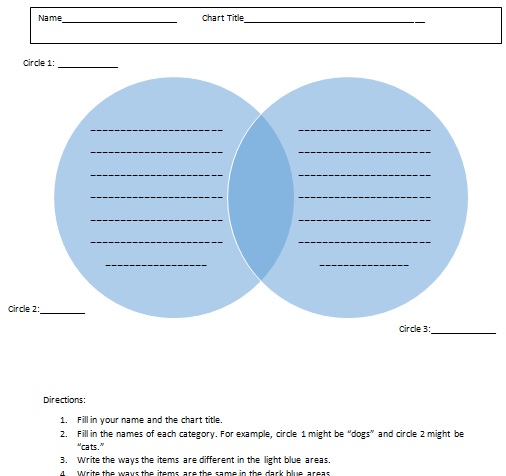
Venn Diagram Templates: Instructions.
Not sure how to use the Venn Diagram Template? Basic instructions are included on the template. If you aren’t sure about how to fill them in (i.e. for intersections or unions), read the top of this article for how to draw both.
Notes on the Venn Diagram Templates:
Although I included a four-circle diagram in the Venn Diagram Templates download, it’s very unusual to have Venn Diagrams for more than three circles. If you have four categories you want to compare, you’re probably better off using a pie chart or segmented bar chart. There are a couple of reasons:
- When you have four circles, the areas where the circles overlap are very small compared to the size of the circles. Therefore, unless you have a very large piece of paper, you’ll have to write in very small print.
- Venn diagrams are often used as an introduction to graphs in elementary school. While a two-circle Venn diagram is easy to understand (with one central area), four circles have nine central areas. This can be really confusing to try and figure out what goes where.
Check out our YouTube channel for more stats tips and help!
References
Agresti A. (1990) Categorical Data Analysis. John Wiley and Sons, New York.
Dodge, Y. (2008). The Concise Encyclopedia of Statistics. Springer.
Gonick, L. (1993). The Cartoon Guide to Statistics. HarperPerennial.
Kotz, S.; et al., eds. (2006), Encyclopedia of Statistical Sciences, Wiley.
Vogt, W.P. (2005). Dictionary of Statistics & Methodology: A Nontechnical Guide for the Social Sciences. SAGE.