Probability and Statistics > Probability > How to Create an Euler Diagram
Euler diagram: Overview
An Euler diagram is similar to a Venn diagram. While both use circles to create diagrams, there’s a major difference: Venn diagrams represent an entire set, while Euler diagrams can represent a part of a set. A Venn diagram can also have a shaded area to show an empty set. That area in an Euler diagram could simply be missing from the diagram altogether.
Euler diagrams are challenging to draw, so software such as Smart Draw or Venn Master may be better options than drawing one by hand.
Euler diagram: Steps
Sample question: Draw an Euler diagram to represent the following statements:
- All wizards can do magic.
- No lizards can do magic.
- No wizard is a lizard.
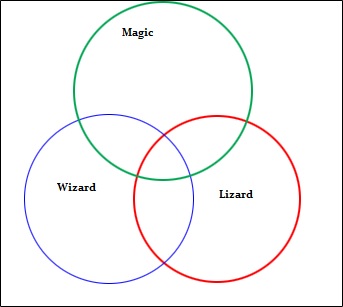
Step 1: Draw three circles to represent the three categories (wizard, lizard, magic). Overlap them all. If you’re drawing the diagram by hand, use a pencil so you can change the circles later:
Step 2: Read the first statement and move the corresponding circle. “All wizards can do magic” must mean that the entire wizard circle has to be inside the magic circle.
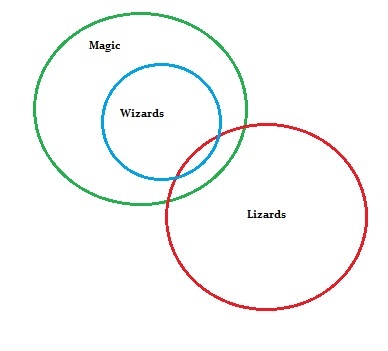
Step 2: Read the second statement and move the corresponding circle. “No lizards can do magic” must mean that the entire lizard circle has to be outside the magic circle.
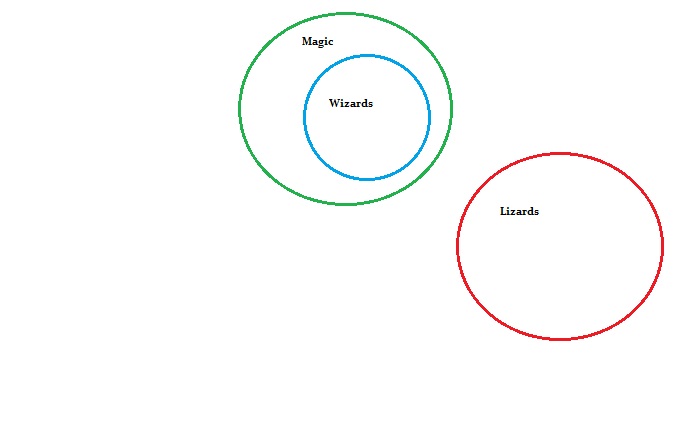
Step 3: Read the third statement and move the corresponding circle . “No wizards are lizards” must mean that the entire lizard circle has to be outside the wizard circle. In this case, the graph already has the lizard circle outside the wizard circle, so we’re done!
Reference:
University of Kent: Euler diagrams. Retrieved October 19th, 2015 from: http://www.cs.kent.ac.uk/events/conf/2004/euler/eulerdiagrams.html.