Probability > Joint Probability / Joint Distribution
What is Joint Probability?
Can’t watch the video? Click here.
Joint probability is the probability of two events happening together. The two events are usually designated event A and event B. In probability terminology, it can be written as:
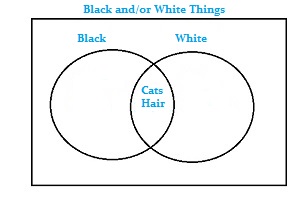
Joint probability can also be described as the probability of the intersection of two (or more) events. The intersection can be represented by a Venn diagram:
Example
Example: The probability that a card is a five and black = p(five and black) = 2/52 = 1/26. (There are two black fives in a deck of 52 cards, the five of spades and the five of clubs).
You can find several more examples here: Probability of A and B.
Joint Probability Distribution
A joint probability distribution shows a probability distribution for two (or more) random variables. Instead of events being labeled A and B, the norm is to use X and Y. The formal definition is:
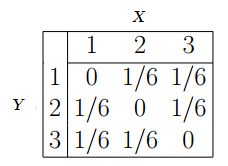
You can use the table to find probabilities. For example:
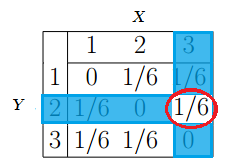
Question: What is the probability for Y = 2 and X = 3?
Answer: Look at the table for the intersection of Y = 2 and X = 3. The answer (1/6) is circled:
See also: Joint Frequency.
Joint Probability Mass Function
If your variables are discrete (like in the above table example), their distribution can be described by a joint probability mass function (Joint PMF). Basically, if you have found all probabilities for all possible combinations of X and Y, then you have created a joint PMF.
Joint Probability Density Function
If you have continuous variables, they can be described with a probability density function (PDF). Unlike the discrete variable example above, you can’t write out every combination of every variable because you would have infinite possibilities to write out (which is, of course, impossible). What you can do is create a formula; The formula that describes all possible combinations of X and Y is called a joint PDF. For more on PDFs, see: What is a Probability Density Function?
References
Beyer, W. H. CRC Standard Mathematical Tables, 31st ed. Boca Raton, FL: CRC Press, pp. 536 and 571, 2002.
Gonick, L. (1993). The Cartoon Guide to Statistics. HarperPerennial.
Klein, G. (2013). The Cartoon Introduction to Statistics. Hill & Wamg.
Wheelan, C. (2014). Naked Statistics. W. W. Norton & Company