Probability > Benford’s Law (The First Digit Law)
What is Benford’s Law?
Benford’s law (also called the first digit law) states that the leading digits in a collection of data sets are probably going to be small. For example, most numbers in a set (about 30%) will have a leading digit of 1, when the expected probability is 11.1% (i.e. one out of nine digits). This is followed by about 17.5% starting with a number 2. This is an unexpected phenomenon; If all leading numbers (0 through 9) had equal probability, each would occur 11.1% of the time. To put it simply, Benford’s law is a probability distribution for the likelihood of the first digit in a set of numbers (Frunza, 2015).
The law only works for the significand* S(x) (Hill and Berger, 2017), which is essentially any number placed into a standard format. To find the significand:
- Find the first non-zero digit,
- Move the decimal point to immediate right of that digit,
- Ignore the sign.
For example, 2092, and −0.02092 both have S(x) = 2.092.
*The significand is part of a number in floating point arithmetic and scientific notation; Any positive number x can be written as S(x) · 10k. For example, the number 8201.24709 can be written as 8.20124709 * 103 in scientific notation. The significand is 8.20124709 (the 3 is called the exponent and 8 is the leading digit).
Formula
The formula for the Benford’s law is:
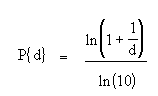
Where “d” (the leading digit) is a number from 1 to 9.
For example, the probability of the first digit being a 1 is:
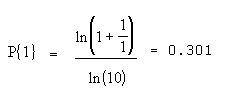
The following image shows the probability distribution for all digits:
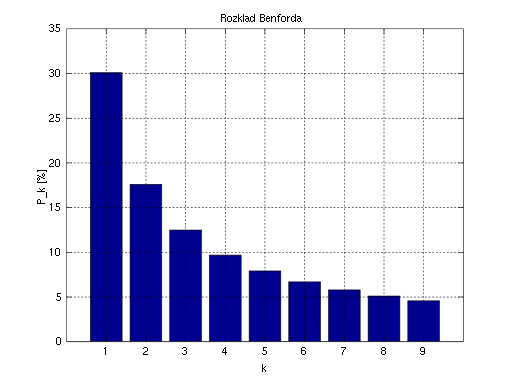
Benford’s law can also be used to make predictions about what the second, third and subsequent leading digits will be as well as the probabilities for certain number combinations.
Benford’s law doesn’t apply to every set of numbers, but it usually applies to large sets of naturally occurring numbers with some connection like:
- Companies’ stock market values,
- Data found in texts — like the Reader’s Digest, or a copy of Newsweek.
- Demographic data, including state and city populations,
- Income tax data,
- Mathematical tables, like logarithms,
- River drainage rates,
- Scientific data.
The law usually doesn’t apply to data sets that have a stated minimum and maximum, like interest rates or hourly wages. If numbers are assigned, rather than naturally occurring, they will also not follow the law. Examples of assigned numbers include: zip codes, telephone numbers and Social Security numbers.
Uses
One practical use for Benford’s law is fraud and error detection. It’s expected that a large set of numbers will follow the law, so accountants, auditors, economists and tax professionals have a benchmark what the normal levels of any particular number in a set are.
- In the latter half of the 1990s, accountant Mark Nigrini found that Benford’s law can be an effective red-flag test for fabricated tax returns; True tax data usually follows Benford’s law, whereas made-up returns do not.
- The law was used in 2001 to study economic data from Greece, with the implication that the country may have manipulated numbers to join the European Union.
- Ponzi schemes can be detected using the law. Unrealistic returns, such as those purported by the Maddoff scam, fall far from the expected Benford probability distribution (Frunza, 2015).
History
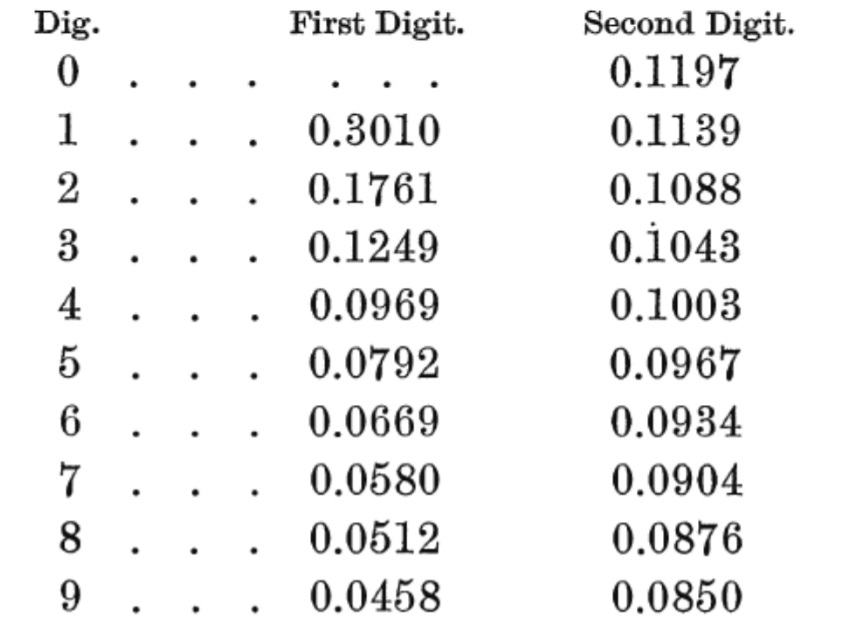
Although it’s called Benford’s law, he wasn’t the first person to study the phenomenon. Astronomer Simon Newcomb (1881) — future president of the American Mathematical Society — laid the foundations for the law after looking logarithm tables. He noticed that the first pages were more worn and smudged than later pages. Newcomb concluded “the first digit is oftener 1 than any other digit” and published his findings in Note on the Frequency of Use of the Different Digits in Natural Numbers, which appeared in The American Journal of Mathematics. Newcomb included a table for probabilities of 1st and 2nd digits, d:
The noted French mathematician Henri Poincaré developed the idea further, in Répartition des décimales dans une table numérique (distribution of decimals in numerical tables). The law gets its named from General Electric company physicist Frank Benford, who re-discovered Newcomb’s findings and popularized it. Benford used varying number sets to demonstrate the law. He studied 20,229 observations from 20 different data sets, including:
- A list of street addresses,
- Molecular weights and specific heats for thousands of chemicals,
- Surface areas of 335 rivers,
- Mathematical sequences,
- An issue of Reader’s Digest.
Benford published his findings in the article The Law of Anomalous Numbers in Proceedings of the American Philosophical Society (1938). As an example, he found the following percentages in Reader’s Digest (total count, 308 instances):
- 1 = 33.4%
- 2 = 18.5%
- 3 = 12.4%
- 4 = 7.5%
- 5 = 7.1%
- 6 = 6.5%
- 7 = 5.5%
- 8 = 4.9%
- 9 = 4.2%
Benford noted himself that an individual data set, such as this one, may not fit the law. However, the mean of a large number of data sets will.
“Proof” it Works
The law is hard to prove mathematically, as it’s more akin to a theory that works (sort of like the multiplication rule). Many attempts have been made to explain the phenomenon, ranging from Benford’s initial thoughts about the logarithmic nature of data to Hill’s probability framework which used mixtures from different probability distributions to partially explain it. At the time of writing, there hasn’t yet been a complete answer to the question of why it works. But work it does — kind of. Diaconis and Freedman (1979) suggest Benford was rather liberal with how he rounded off numbers, to make the data better fit the equation.
My Own Experiment
 Perhaps the best way to convince yourself the law works is to pick up a random book or magazine and list/sort the numbers — about 30% of the numbers collected from any issue will start with the number 1. I did this myself, for the Oct 16, 2017 issue of Time. This just happened to be the nearest reading material to where I was sitting, which could probably qualify as random seeing as there’s a lot of books and magazines at my house.
The Result: Out of 702 total numbers, 201 (29%) started with the number 1.
Technical note: I only counted the first number in a string. For example, 503(c)(3) or 2017-22.
Some things I noticed on the nature of numbers
These may partially explain why there are more more “1”s than any other number:
- Statistics are often quoted as “1 in 8”, or “1 out of 9”, or some other “1 out of nnn”. It’s rare you see another number like “3 out of 10” or “4 out of 17.”
- Any list is definitely going to have 11 ones in the first 20 numbers (1…10, 11, 12, 13, 14, 15, 16, 17, 18, 19).
- Most books have page numbers, and most books or magazines have at least 20 pages (which means 11 ones). Shorter magazines and books will have fewer 9s, 8s, 7s, but they will always have those 11 numbers beginning with 1.
- The same logic applies to ages of people. There are a lot more people alive aged 11-19 than there are in their 80s or 90s.
About a third of days of the month begin with a 1 (1st, 10th, 11th etc.). No days of the month begin with a 4, 5, 6, 7, 8,or 9. - As this is Time magazine, there are lots of dates. And as this is 2017, there’s lots of 2017 mentions (in fact, lots of 2xxx). It begs the question: would issues from last century (19xx) sway the numbers another way? Probably. This is why a one-sample test isn’t good for much. But I don’t have the time or inclination to make this a large-sample test!
- Toll free phone numbers begin with 1 (e.g. 1-866-821-7406). In a news magazine, or any magazine with ads, there’s a lot of toll-free numbers.
In conclusion, it should seem obvious that there will be more “1”s than any other number, because this is where we start to count anything.
References
Benford, F. “The Law of Anomalous Numbers,” Proceedings of the American Philosophical Society, 78, 551–572. 1938.
Diaconis, P. and Freedman, D. “On rounding percentages,” J. Amer. Stat. Assoc., 74 (1979) 359–364. MR 81d:62014
Frunza, M. (2015). Solving Modern Crime in Financial Markets: Analytics and Case Studies. Academic Press.
Hill, T. P. “The First Digit Phenomenon.” Amer. Sci. 86, 358-363, 1998.
Newcomb, S. “Note on the Frequency of the Use of Digits in Natural Numbers.” Amer. J. Math. 4, 39-40, 1881.
Nigrini, N. (1999). I’ve Got Your Number. Retrieved November 8, 2017 from: https://www.journalofaccountancy.com/issues/1999/may/nigrini.html
Poincaré, H. Répartition des décimales dans une table numérique. pp 313-320 in: Calcul des Probabilités, Gauthier-Villars, Paris.
Rauch, B. et. al. “Fact and Fiction in EU-Governmental Economic Data.” German Economic Review.