Probability frequency distribution questions always have the term “frequency distribution” in the question. For example, the question might ask you to figure out the probability of a simple event happening, using a frequency distribution table. If you don’t have the phrase “frequency distribution” in the question, see other problem types in the probability index.
Watch the video to learn how to solve a simple problem involving a probability frequency distribution:
Probability frequency distribution: Overview.
A probability frequency distribution is a way to show how often an event will happen. It also shows what the probability of each event happening is. A frequency distribution table can be created by hand, or you can make a frequency distribution table in Excel.

Probability frequency distribution: Steps
Sample question: In a sample of 43 students:
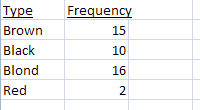
- 15 had brown hair.
- 10 had black hair.
- 16 had blond hair.
- 2 had red hair.
Use a frequency distribution table to find the probability a person has neither red nor blond hair.
Step 1: Make a frequency distribution table.
List the items in one column and the number of items in a second column. In this case, your items are hair colors: brown, black, blond, red.

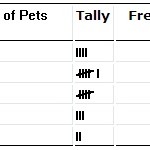
Tip: If you have a large number of items, use tally marks to help you find the total.
Step 2: Add up the totals.
In the sample question we’re asked for the odds a person will not have blond or red hair. In other words, we want to know the probability of a person having black or brown hair. Note that you’re told in the question there are 43 students in the class.
Brown = 15/43 (15 out of 43 students have brown hair).
Black = 10/43 (10 out of 43 students have black hair).
Add these together to get the total number of students who have brown or black hair.
15/43 + 10/43 = 25/43 (25 out of 43 students have either brown or black hair).
You’re done with solving this Probability frequency distributi