- What are Critical Values?
- Critical Value of Z
- Finding Critical Values
- Critical Values and Working with Samples
- Other Types of Critical Values.
- What does Significance Testing Tell Us?
- More Critical Value Articles.
1. What are Critical Values?
A critical value is a point or threshold on a probability distribution that helps you figure out whether to support or reject the null hypothesis in hypothesis testing. It is used to define the boundary between the acceptance region and rejection region for a given significance level.
Watch the video below for an overview on critical values:

Can’t see the video? Click here to watch it on YouTube.
Visually, a critical value is a line on a graph that splits the graph into sections — one of which is called the rejection region; if your test value falls into the this region, then you reject the null hypothesis for your test. 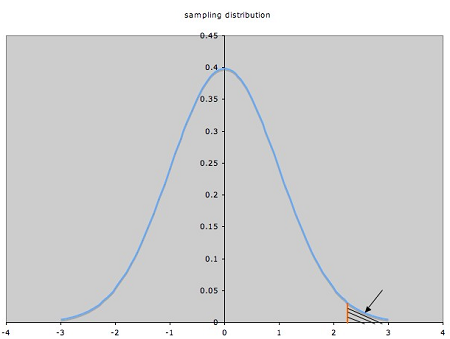 A rejection region in the right tail, shown by the shaded area.
The critical value is the red line to the left of that region. Critical values come in all shapes and sizes, but the one you’ll come across first in statistics is the critical value of Z.
Fast facts:
- The critical value is always positive. This is because it represents the point at which the probability of observing a sample statistic at least as extreme as the one observed falls below a certain level, such as 0.05 or 0.01.
- The critical value increases as the significance level decreases. This is because a lower significance level means that we are less willing to accept a false positive result, so we require a more extreme sample statistic in order to reject the null hypothesis.
- The critical value decreases as the degrees of freedom increases. This is because with more degrees of freedom, the sampling distribution of the sample statistic becomes more normal, and so we need a less extreme sample statistic in order to reject the null hypothesis.
Note: A critical number, used in calculus, is not the same thing as a critical value. Critical numbers are used in calculus to find points where a graph changes from increasing to decreasing, or vice-versa.
2.Critical Values of Z
The critical value of z is term linked to the area under the standard normal model. Critical values can tell you what probability any particular data point will have. 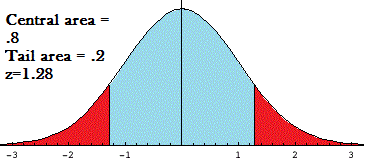
The above graph of the normal distribution curve shows a critical value of 1.28. The graph has two parts:
-
-
- Central region: The z-score is equal to the number of standard deviations from the mean. A score of 1.28 indicates that the variable is 1.28 standard deviations from the mean. If you look in the z-table for a z of 1.28, you’ll find the area is .3997. This is the region to the right of the mean, so you’ll double it to get the area of the entire central region: .3997*2 = .7994 or about 80 percent.

- Tail region: The area of the tails (the red areas) is 1 minus the central region. In this example, 1-.8 = .20, or about 20 percent. The tail regions are sometimes calculated when you want to know how many variables would be less than or more than a certain figure.
- Central region: The z-score is equal to the number of standard deviations from the mean. A score of 1.28 indicates that the variable is 1.28 standard deviations from the mean. If you look in the z-table for a z of 1.28, you’ll find the area is .3997. This is the region to the right of the mean, so you’ll double it to get the area of the entire central region: .3997*2 = .7994 or about 80 percent.
-

A critical value of z is sometimes written as za, where the alpha level, a, is the area in the tail. For example, z.10 = 1.28.
When are Critical values of z used?
A critical value of z (Z-score) is used when the sampling distribution is normal, or close to normal. Z-scores are used when the population standard deviation is known or when you have larger sample sizes.
While the z-score can also be used to calculate probability for unknown standard deviations and small samples, in real life you’ll probabably use the t distribution to calculate these probabilities. That’s because you often don’t know the population variance (which is a requirement for using the z test).
Other uses of z-scores
Every statistic has a probability, and every probability calculated for a sample has a margin of error. The critical value of z can also be used to calculate the margin of error.
-
-
- Margin of error = Critical value * Standard deviation of the statistic.
- Margin of error = Critical value * Standard error of the sample.
-
3. Find Critical Values in Any Tail
-
-
- Find a critical value for a confidence level
- Common confidence levels and their critical values
- Two-Tailed Test
- Right-Tailed Test
- Left-Tailed Test
-
A. Find a critical value for a confidence level
Watch the video below to learn about finding a critical value for a confidence level:

Can’t see the video? Click here to watch it on YouTube.
Example question: Find a critical value for a 90% confidence level (Two-Tailed Test).
-
-
- Subtract the confidence level from 100% to find the α level: 100% – 90% = 10%.
- Convert Step 1 to a decimal: 10% = 0.10.
- Divide Step 2 by 2 (this is called “α/2”). So: 0.10 = 0.05. This is the area in each tail.
- Subtract Step 3 from 1 (because we want the area in the middle, not the area in the tail): So: 1 – 0.05 = .95.
- Look up the area from Step in the z-table. The area is at z=1.645. This is your critical value for a confidence level of 90%.
-
B. Common confidence levels and their critical values
You don’t have to perform the above calculations every time. This list of z- critical values and their associated confidence levels were calculated using the above steps:
| Confidence Level | Two Sided CV | One Sided CV |
| 90% | 1.64 | 1.28 |
| 95% | 1.96 | 1.65 |
| 99% | 2.58 | 2.33 |
C. Find Critical Values: Two-Tailed Test
Watch the video or read the steps below:

-
-
- Subtract alpha from 1. (1 – .05 = .95).
- Divide Step 1 by 2 (because we are looking for a two-tailed test). (.95 / 2 = .475).
- Look at your z-table and locate the answer from Step 2 in the middle section of the z-table. The fastest way to do this is to use the find function of your browser (usually CTRL+F). In this example we’re going to look for .475, so go ahead and press CTRL+F, then type in .475.
- In this example, you should have found the number .4750. Look to the far left or the row, you’ll see the number 1.9 and look to the top of the column, you’ll see .06. Add them together to get 1.96. That’s the critical value!
-
Tip: The critical value appears twice in the z table because you’re looking for both a left hand and a right hand tail, so don’t forget to add the plus or minus sign! In our example you’d get ±1.96. Back to Top
D. Find a Critical Value: Right-Tailed Test
Example question: Find a critical value in the z-table for an alpha level of 0.0079.
- Draw a diagram, like the one above. Shade in the area in the right tail. This area represents alpha, α. A diagram helps you to visualize what area you are looking for (i.e. if you want an area to the right of the mean or the left of the mean).
- Subtract alpha (α) from 0.5. 0.5-0.0079 = 0.4921.
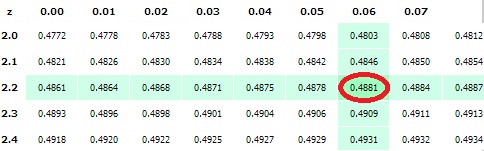
- Find the result from step 2 in the center part of the z-table. The closest area to 0.4921 is 0.4922 at z = 2.42.

E. Find a Critical Value: Left-Tailed Test
Example question: find the critical value in the z-table for α = .012 (left-tailed test). 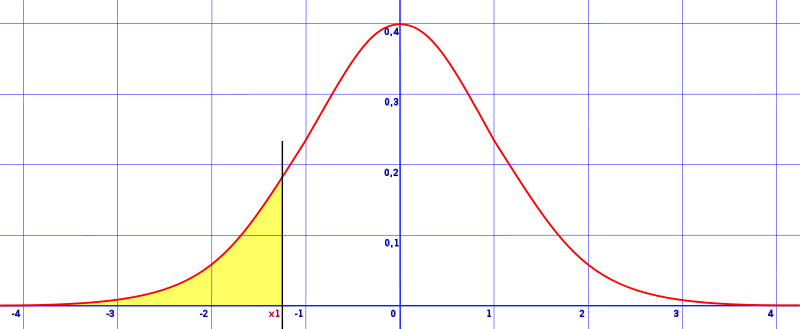
- Draw a diagram, like the one above. Shade in the area in the left tail (because you’re looking for a critical value for a left-tailed test). This area represents alpha, α .
- Subtract alpha (α) from 0.5. 0.5 – 0.012 = 0.488.
- Find the result from step 2 in the center part of the z-table. The closest area to 0.488 is at z = 2.26. If you can’t find the exact area, just find the closest number and read the z value:

- Add a negative sign to Step 3 (left-tail critical values are always negative). -2.26.
That’s it!
4. Critical Values and Working with Samples
Critical values are used in statistics for hypothesis testing. When you work with statistics, you’re working with a small percentage (a sample) of a population. For example, you might have statistics for voting habits from two percent of democratic voters, or five percent of students and their test results.
Because you’re working with a fraction of the population and not the entire population, you can never be one hundred percent certain that your results reflect the actual population’s results. You might be 90 percent certain, or even 99 percent certain, but you can never be 100 percent certain. How accurate are your results? You can tell with hypothesis testing.
5. Types of Critical Values
Various types of critical values are used to calculate significance, including: t scores from student’s t-tests, chi-square, and z-tests.
In each of these tests, you’ll have an area where you are able to reject the null hypothesis, and an area where you cannot. The line that separates these two regions is where your critical values are located. 
In the above image, the critical values are at 1.28 or -1.28.
- The blue area is where you must accept the null hypothesis.
- The red areas are where you can reject the null hypothesis.
How large these areas actually are (and what test you use) is dependent on many factors, including your chosen confidence level and your sample size.
Significance Testing Example
Significance testing is used to figure out if your results differ from the null hypothesis.
The null hypothesis is just an accepted fact about the population. For example, your school may make a statistics course mandatory for nursing students because research has shown that patient outcomes improve when nurses have a statistics background. You might think that there’s no difference. Instead of trying to prove that there’s no difference, proper research techniques dictate that you’ll try to disprove the opposite — the null hypothesis, which in this case is that “patient outcomes improve when nurses have a statistics background.”
In order to disprove, or reject, the null hypothesis, your research must pass a test of significance.
6. What does Significance Testing Tell Us?
Significance testing is used to calculate the probability that a relationship between two variables (like “taking a statistics class” and “improved patient outcomes”) is just due to chance. It helps to answer the question of whether you could duplicate your test results accurately in further research.
By using probability and the normal curve, you can figure out what the chance is that your research is wrong.
Steps in Testing for Statistical Significance:
-
-
- State the Alternate Hypothesis.
- State the Null Hypothesis.
- Select a probability of error level (alpha level).
- Select and compute the test for statistical significance (i.e. calculate a z-score.)
- Interpret the results.
-
6. More Critical Values Articles
References