Hypothesis Testing > Rejection Region
What is a Rejection Region?
Watch the video for an overview of the rejection region, or read on below.
A rejection region, also called a critical region, is an area where the null hypothesis is rejected. If the test results are significant enough to throw out the null hypothesis, they will fall into this rejection area. The primary purpose of statistics is to test theories or experimental results. For example, suppose you have developed a new drug for bacterial infections that you believe increases survival rates by 5%. To prove your theory, your experiment must:
- Be repeatable.
- Be compared to a known fact about bacterial infection survival, such as the average survival rate without the new drug.
This type of testing is called a hypothesis test, and the rejection region forms part of this process. Specifically, it is equal to the probability of your hypothesis being true. The rejection region in a hypothesis test depends on the alpha (significance) level, the alternate hypothesis, and the type of test.
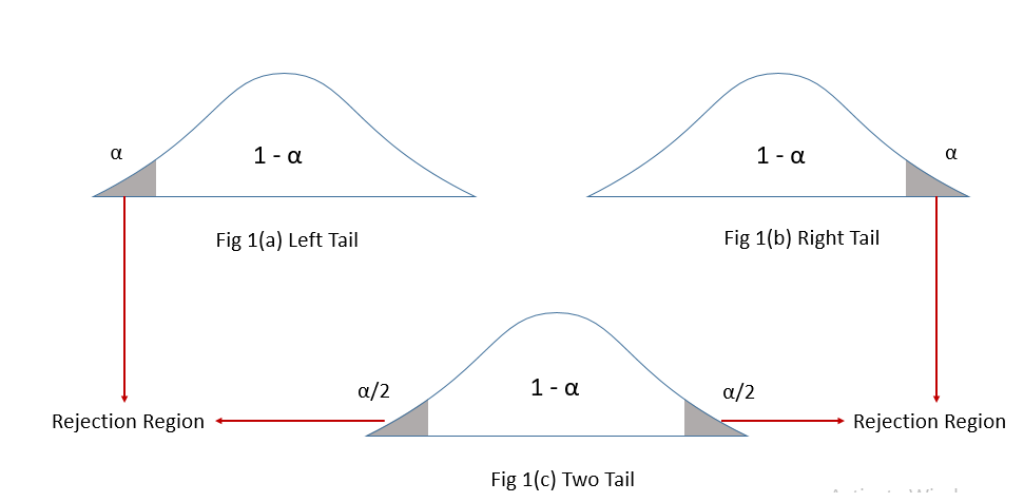
Two Tailed vs One Tailed
The number of rejection regions is determined by your alternate hypothesis (your hypothesis).
For example, if your hypothesis states, “The average survival rate is greater than five months” it is a one-tailed test as you are only interested in the positive (right) direction on the number line — greater than 5 months.
A “less than” scenario would also have one tail — in the negative (left) direction on the number line. For example, “The survival rate less than five months”. A two-tailed test, with two regions, is used when you want to detect differences in both directions (greater than and less than).
The alpha (significance) level determines the size of the rejection region. For example, if you want to be 95% confident that your results are significant, you would select a 5% alpha level (100% – 95% = 5%). This 5% alpha level represents the rejection region. In a one-tailed test, the 5% is in one tail, while in a two-tailed test, the rejection region would encompass both tails.
Rejection Regions and Alpha Levels
You, as a researcher, choose the alpha level you are willing to accept. For example, if you wanted to be 95% confident that your results are significant, you would choose a 5% alpha level (100% – 95%). That 5% level is the rejection region. For a one tailed test, the 5% would be in one tail. For a two tailed test, the rejection region would be in two tails.
Rejection Regions and P-Values.
There are two ways you can test a hypothesis: with a p-value and with a critical value.
- P-value method: When you run a hypothesis test (for example, a z test), the result of that test will be a p value. The p value is a “probability value.” It’s what tells you if your hypothesis statement is probably true or not. If the value falls in the rejection region, it means you have statistically significant results; You can reject the null hypothesis. If the p-value falls outside the rejection region, it means your results aren’t enough to throw out the null hypothesis. In the example of the plant fertilizer, a statistically significant result would be one that shows the fertilizer does indeed make plants grow faster (compared to other fertilizers).
- Rejection Region method with a critical value: The steps are exactly the same. However, instead of calculating a p-value you calculate a critical value. If the value falls inside the region, you reject the null hypothesis.
Rejection region vs. acceptance region
The acceptance region is the complement of the rejection region (i.e., they are opposites).
- The rejection region represents the set of values of the test statistic that lead to rejecting the null hypothesis. A test statistic is calculated from sample data and is used to compare the observed and expected data under the null hypothesis. Which test statistic you use depends on the type of hypothesis test. For example the F-statistic is used for ANOVA tests and the chi-squared statistic is used for chi-squared tests.
- The acceptance region comprises the set of values where the null hypothesis is not rejected.
The size and placement of the rejection region relies on the significance level, α, and the alternative hypothesis. The acceptance region is the remaining area:
- In a one-tailed test, the rejection region is on one side of the test statistic distribution; the acceptance region occupies the other side.
- In a two-tailed test, the rejection region is on both sides of the test statistic distribution, while the acceptance region lies in the middle.
| Type of test | Significance level (α) | Alternative hypothesis (H1) | Rejection region | Acceptance region |
|---|---|---|---|---|
| One-tailed | 0.05 | μ > μ0 | Right tail | Left tail and middle |
| One-tailed | 0.05 | μ < μ0 | Left tail | Right tail and middle |
| Two-tailed | 0.05 | μ ≠ μ0 | Both tails | Middle |
Once you’ve figured out the rejection region and the acceptance region, you can compare the value of the test statistic to the critical value(s). If the test statistic value falls in the rejection region, we reject the null hypothesis. Otherwise, if it falls into the acceptance region, we fail to reject the null hypothesis.
Note that the “acceptance” region is somewhat of a misnomer. We never actually “accept” anything! We do not “accept” the alternate hypothesis, for example. We merely support or reject the null.
What is the difference between p-value and rejection region?
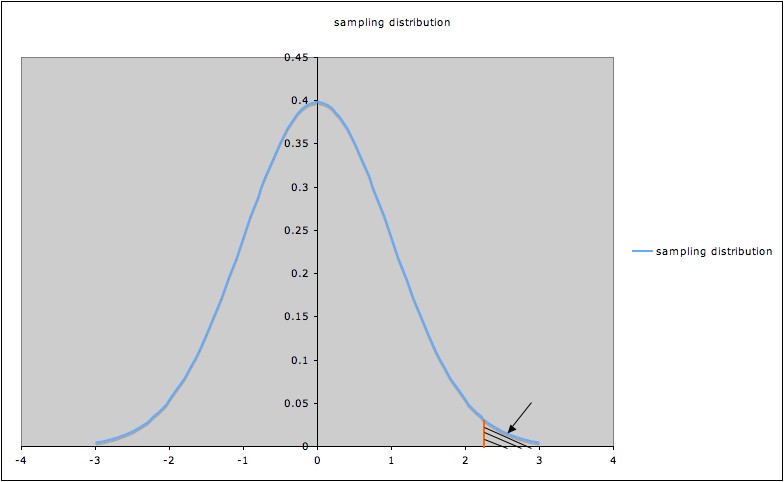
On a graph of the distribution of a test statistic, the rejection region is a portion of the x-axis. The p-value is a tool to see if the test statistic falls into the rejection region [2].
Is the rejection region the same as the significance level?
The rejection region and the significance level are different concepts:
- The rejection region refers to ta set of test statistic values that lead us to reject the null hypothesis.
- The significance (alpha) level represents the probability of rejecting the null hypothesis when it is actually true. For example, a significance level of 5% (0.05) indicates a 5% chance of rejecting the null hypothesis when it is true.
The size and placement of the rejection region depends on factors such as the significance level and the type of test. Normally, the significance level is decided before collecting data; the rejection region is determined afterward.
What is the most powerful rejection region?
The most powerful region is the region with the highest probability of rejection when the null hypothesis is false.
A test that has the most powerful rejection region for all possible alternative hypotheses is called a uniformly most powerful (UMP) test. In other words, an UMP test is a test that has the highest power among all tests of the same significance level (α-level).
It is not always possible to find a UMP test. Sometimes, multiple tests may have the same power against all possible alternative hypotheses. In these cases, we can choose the test that is easiest to calculate or interpret.
The most powerful rejection region is not always the best choice. Sometimes, we may prefer a test with lower power but is more conservative. For example, in medical trials, we might want to choose a test with a lower probability of rejecting the null hypothesis when it is actually true. Low power means that a test only has a small chance of detecting a true effect, which means you’re being (almost) certain that the drug is safe/effective.
Examples of UMP tests include the one-sample t-test and the chi-square test. Check out our YouTube channel for more stats help and tips!
References
- Manishsahu7158, CC BY-SA 4.0, via Wikimedia Commons
- Vogan, D. (2018). Null Hypothesis Significance Testing p-values, significance level, power, t-tests.