When a poll is reported in the media, a confidence level is often included in the results. For example, a survey might report a 95 percent confidence level. But what exactly does this mean? At first glance you might think that it means it’s 95 percent accurate. That’s close to the truth, but like many things in statistics, it’s actually a little more defined.
Real Life Example
Example: A recent article on Rasmussen Reports states that “38% of Likely U.S. Voters now say their health insurance coverage has changed because of Obamacare”. If you scroll down to the bottom of the article, you’ll see this line: “The margin of sampling error is +/- 3 percentage points with a 95% level of confidence.”
It’s impractical to survey all 300 million+ U.S. residents, so it’s impossible to know exactly how many people would actually respond “yes my health insurance has changed.” We take a sample (say, 2,000 people) and, using good statistical techniques like simple random sampling, take our “best guess” at what that actual figure is (we call that unknown figure a population parameter). What a 95 percent confidence level is saying is that if the poll or survey were repeated over and over again, the results would match the results from the actual population 95 percent of the time.
What about “+/- 3 percentage points”?
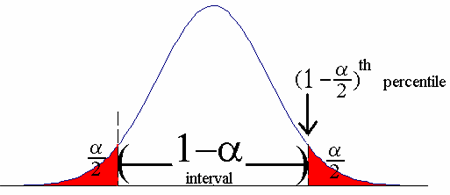
The width of the confidence interval tells us more about how certain (or uncertain) we are about the true figure in the population. This width is stated as a plus or minus (in this case,+/- 3) and is called the confidence interval. When the interval and confidence level are put together, you get a spread of percentage. In this case, you would expect the results to be 35 (38 – 3) to 41 (38 + 3) percent, 95% of the time.
Factors that Affect Confidence Intervals (CI)
- Population size: this does not usually affect the CI but can be a factor if you are working with small and known groups of people.
- Sample Size: the smaller your sample, the less likely it is you can be confident the results reflect the true population parameter.
- Percentage: Extreme answers come with better accuracy. For example, if 99 percent of voters are for gay marriage, the chances of error are small. However, if 49.9 percent of voters are “for” and 50.1 percent are “against” then the chances of error are bigger.
0% and 100% Confidence Level
A 0% confidence level means you have no faith at all that if you repeated the survey that you would get the same results. A 100% confidence level means there is no doubt at all that if you repeated the survey you would get the same results. In reality, you would never publish the results from a survey where you had no confidence at all that your statistics were accurate (you would probably repeat the survey with better techniques). A 100% confidence level doesn’t exist in statistics, unless you surveyed an entire population — and even then you probably couldn’t be 100 percent sure that your survey wasn’t open to some kind or error or bias.
Confidence Coefficient
The confidence coefficient is the confidence level stated as a proportion, rather than as a percentage. For example, if you had a confidence level of 99%, the confidence coefficient would be .99.
In general, the higher the coefficient, the more certain you are that your results are accurate. For example, a .99 coefficient is more accurate than a coefficient of .89. It’s extremely rare to see a coefficient of 1 (meaning that you are positive without a doubt that your results are completely, 100% accurate). A coefficient of zero means that you have no faith that your results are accurate at all.
The following table lists confidence coefficients and the equivalent confidence levels.
| Confidence coefficient (1 – α) | Confidence level (1 – α * 100%) |
| 0.90 | 90 % |
| 0.95 | 95 % |
| 0.99 | 99 % |
References
Beyer, W. H. CRC Standard Mathematical Tables, 31st ed. Boca Raton, FL: CRC Press, pp. 536 and 571, 2002.
Gonick, L. (1993). The Cartoon Guide to Statistics. HarperPerennial.
Klein, G. (2013). The Cartoon Introduction to Statistics. Hill & Wamg.
Vogt, W.P. (2005). Dictionary of Statistics & Methodology: A Nontechnical Guide for the Social Sciences. SAGE.