Contents:
- Hypothesis Testing Basics: One Tail or Two?
- Left Tailed Test or Right Tailed Test? Example
- How to Run a Right Tailed Test
Hypothesis Testing Basics: One Tail or Two?
Watch the video for an overview of one-tailed tests (left and right) or two tails:
In a hypothesis test, you have to decide if a claim is true or not. Before you can figure out if you have a left tailed test or right tailed test, you have to make sure you have a single tail to begin with. A tail in hypothesis testing refers to the tail at either end of a distribution curve.

Basic Hypothesis Testing Steps
Need help with a homework question? Check out our tutoring page!
- Decide if you have a one-tailed test or a two-tailed test (How to decide if a hypothesis test is a one-tailed test or a two-tailed test). If you have a two-tailed test, you don’t need to worry about whether it’s a left tailed or right tailed test (because it’s both!).
- Find out if it’s a left tailed test or right tailed test (see below).
If you can sketch a graph, you can figure out which tail is in your test.
Back to Top
Left Tailed Test or Right Tailed Test? Example
Example question: You are testing the hypothesis that the drop out rate is more than 75% (>75%). Is this a left-tailed test or a right-tailed test?
Step 1: Write your null hypothesis statement and your alternate hypothesis statement. This step is key to drawing the right graph, so if you aren’t sure about writing a hypothesis statement, see: How to State the Null Hypothesis.
Step 2: Draw a normal distribution curve.
Step 3: Shade in the related area under the normal distribution curve. The area under a curve represents 100%, so shade the area accordingly. The number line goes from left to right, so the first 25% is on the left and the 75% mark would be at the left tail.
The yellow area in this picture illustrates the area greater than 75%. Left Tailed Test or Right Tailed Test? From this diagram you can clearly see that it is a right-tailed test, because the shaded area is on the right.
That’s it!
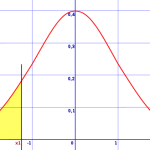
Note: This next picture represent the phrase “less than 25%”. You can see that it would be a left-tailed test from the picture, as the tail is shaded on the left.

Back to Top
How to Run a Right Tailed Test
Hypothesis tests can be three different types:
- Right tailed test.
- Left tailed test.
- Two tailed test.
The right tailed test and the left tailed test are examples of one-tailed tests. They are called “one tailed” tests because the rejection region (the area where you would reject the null hypothesis) is only in one tail. The two tailed test is called a two tailed test because the rejection region can be in either tail.
Here’s what the right tailed test looks like on a graph:
As you can see, the rejection region (shaded in yellow) is to the right of the graph.
What is a Right Tailed Test?
A right tailed test (sometimes called an upper test) is where your hypothesis statement contains a greater than (>) symbol. In other words, the inequality points to the right. For example, you might be comparing the life of batteries before and after a manufacturing change. If you want to know if the battery life is greater than the original (let’s say 90 hours), your hypothesis statements might be:
Null hypothesis: No change or less than (H0 ≤ 90).
Alternate hypothesis: Battery life has increased (H1) > 90.
The important factor here is that the alternate hypothesis(H1) determines if you have a right tailed test, not the null hypothesis.
Right Tailed Test Example.
A high-end computer manufacturer sets the retail cost of their computers based in the manufacturing cost, which is $1800. However, the company thinks there are hidden costs and that the average cost to manufacture the computers is actually much more. The company randomly selects 40 computers from its facilities and finds that the mean cost to produce a computer is $1950 with a standard deviation of $500. Run a hypothesis test to see if this thought is true.
Step 1: Write your hypothesis statement (see: How to state the null hypothesis).
H0: μ ≤ 1800
H1: μ > 1800
Step 2: Find the test statistic using the z-score formula:

z = 1950 – 1800 / (500/√40) = 1.897
Step 3: Choose an alpha level. No alpha is mentioned in the question, so use the standard (0.05).
1 – 0.05 = .95
Look up that value (.95) in the middle of the z-table. The area corresponds to a z-value of 1.645. That means you would reject the null hypothesis if your test statistic is greater than 1.645.*
1.897 is greater than 1.645, so you can reject the null hypothesis.
* Not sure how I got 1.645? The left hand half of the curve is 50%, so you look up 45% in the “right of the mean” table on this site (50% + 45% = 95%).

This z-table shows the area to the right of the mean, so you’re actually looking up .45, not .95. That’s because half of the area (.5) is not actually showing on the table.
Left Tailed Test or Right Tailed Test: References
Dodge, Y. (2008). The Concise Encyclopedia of Statistics. Springer.
Gonick, L. (1993). The Cartoon Guide to Statistics. HarperPerennial.
“Klein, G. (2013). The Cartoon Introduction to Statistics. Hill & Wamg.
Kotz, S.; et al., eds. (2006), Encyclopedia of Statistical Sciences, Wiley.
Wheelan, C. (2014). Naked Statistics. W. W. Norton & Company