Contents (Click to slip to that section):
- One tailed test or two in Hypothesis Testing:
- Onto more technical stuff.
- One tailed distribution (how to find the area)
One tailed test or two in Hypothesis Testing: Overview
Watch the video to understand when to use a one or two tailed test:

Can’t see the video? Click here to watch it on YouTube.
In hypothesis testing, you are asked to decide if a claim is true or not. For example, if someone says “all Floridian’s have a 50% increased chance of melanoma”, it’s up to you to decide if this claim holds merit. One of the first steps is to look up a z-score, and in order to do that, you need to know if it’s a one tailed test or two. You can figure this out in just a couple of steps.
Back to top
One tailed test or two in Hypothesis Testing: Steps
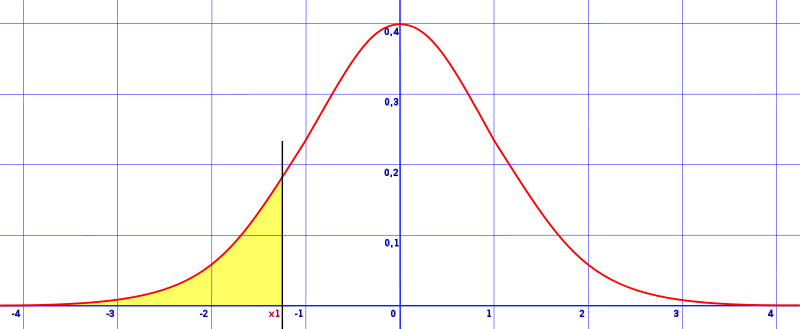
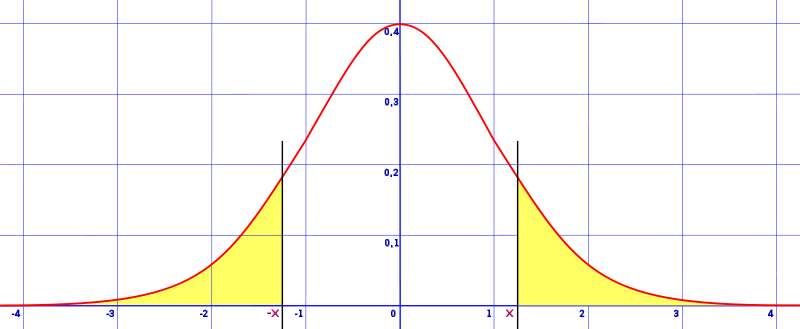
If you’re lucky enough to be given a picture, you’ll be able to tell if your test is one-tailed or two-tailed by comparing it to the image above. However, most of the time you’re given questions, not pictures. So it’s a matter of deciphering the problem and picking out the important piece of information. You’re basically looking for keywords like equals, more than, or less than.
Example question #1: A government official claims that the dropout rate for local schools is 25%. Last year, 190 out of 603 students dropped out. Is there enough evidence to reject the government official’s claim?
Example question #2: A government official claims that the dropout rate for local schools is less than 25%. Last year, 190 out of 603 students dropped out. Is there enough evidence to reject the government official’s claim?
Example question #3: A government official claims that the dropout rate for local schools is greater than 25%. Last year, 190 out of 603 students dropped out. Is there enough evidence to reject the government official’s claim?
Step 1: Read the question.
Step 2: Rephrase the claim in the question with an equation.
- In example question #1, Drop out rate = 25%
- In example question #2, Drop out rate < 25%
- In example question #3, Drop out rate > 25%.
Step 3: If step 2 has an equals sign in it, this is a two-tailed test. If it has > or < it is a one-tailed test.
Like the explanation? Check out the Statistics How To Handbook, which has hundreds of easy to understand definitions and examples, just like this one!
One Tailed Test or Two: Onto some more technical stuff
The above should have given you a brief overview of the differences between one-tailed tests and two-tailed tests. For the very beginning of your stats class, that’s probably all the information you need to get by. But once you hit ANOVA and regression analysis, things get a little more challenging.
1. Alpha levels
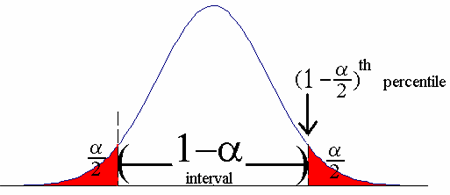
Alpha levels (sometimes just called “significance levels”) are used in hypothesis tests; it is the probability of making the wrong decision when the null hypothesis is true. A one-tailed test has the entire 5% of the alpha level in one tail (in either the left, or the right tail). A two-tailed test splits your alpha level in half (as in the image to the left).
Let’s say you’re working with the standard alpha level of 0.5 (5%). A two tailed test will have half of this (2.5%) in each tail. Very simply, the hypothesis test might go like this:
- A null hypothesis might state that the mean = x. You’re testing if the mean is way above this or way below.
- You run a t-test, which churns out a t-statistic.
- If this test statistic falls in the top 2.5% or bottom 2.5% of its probability distribution (in this case, the t-distribution), you would reject the null hypothesis.
The “cut off” areas created by your alpha levels are called rejection regions. It’s where you would reject the null hypothesis, if your test statistic happens to fall into one of those rejection areas. The terms “one tailed” and “two tailed” can more precisely be defined as referring to where your rejection regions are located.
Back to top
2. Power
A one-tailed test is where you are only interested in one direction. If a mean is x, you might want to know if a set of results is more than x or less than x. A one-tailed test is more powerful than a two-tailed test, as you aren’t considering an effect in the opposite direction.
Next: Left tailed test or right tailed test?
Back to top
3. When Should You Use a One-Tailed Test?
In the above examples, you were given specific wording like “greater than” or “less than.” Sometimes you, the researcher, do not have this information and you have to choose the test.
For example, you develop a drug which you think is just as effective as a drug already on the market (it also happens to be cheaper). You could run a two-tailed test (to test that it is more effective and to also check that it is less effective). But you don’t really care about it being more effective, just that it isn’t any less effective (after all, your drug is cheaper). You can run a one-tailed test to check that your drug is at least as effective as the existing drug.
On the other hand, it would be inappropriate (and perhaps, unethical) to run a one-tailed test for this scenario in the opposite direction (i.e. to show the drug is more effective). This sounds reasonable until you consider there may be certain circumstances where the drug is less effective. If you fail to test for that, your research will be useless.
Consider both directions when deciding if you should run a one tailed test or two. If you can skip one tail and it’s not irresponsible or unethical to do so, then you can run a one-tailed test.
Back to top
One tailed Test or Two: How to find the area of a one-tailed distribution: Steps
There are a few ways to find the area under a one tailed distribution curve. The easiest, by far, is looking up the value in a table like the z-table. A z-table gives you percentages, which represent the area under a curve. For example, a table value of 0.5000 is 50% of the area and 0.2000 is 20% of the area.
If you are looking for other area problems*, see the normal distribution curve index. The index lists seven possible types of area, including two tailed, one tailed, and areas to the left and right of z.
*You can also calculate areas with integral calculus. See The Area Problem.
Note: In order to use a z-table, you need to split your z-value up into decimal places (e.g. tenths and hundredths). For example, if you are asked to find the area in a one tailed distribution with a z-value of 0.21, split this into tenths (0.2) and hundredths (0.01).
One tailed distribution: Steps for finding the area in a z-table
Step 1: Look up your z-score in the z-table. Looking up the value means finding the intersection of your two decimals (see note above). For example, if you are asked to find the area in a one tailed distribution to the left of z = -0.46, look up 0.46 in the table (note: ignore negative values. If you have a negative value, use its absolute value). The table below shows that the value in the intersection for 0.46 is .1772. This figure was obtained by looking up 0.4 in the left hand column and 0.06 in the top row.
| z | 0.00 | 0.01 | 0.02 | 0.03 | 0.04 | 0.05 | 0.06 | 0.07 | 0.08 | 0.09 |
|---|---|---|---|---|---|---|---|---|---|---|
| 0.0 | 0.0000 | 0.0040 | 0.0080 | 0.0120 | 0.0160 | 0.0199 | 0.0239 | 0.0279 | 0.0319 | 0.0359 |
| 0.1 | 0.0398 | 0.0438 | 0.0478 | 0.0517 | 0.0557 | 0.0596 | 0.0636 | 0.0675 | 0.0714 | 0.0753 |
| 0.2 | 0.0793 | 0.0832 | 0.0871 | 0.0910 | 0.0948 | 0.0987 | 0.1026 | 0.1064 | 0.1103 | 0.1141 |
| 0.3 | 0.1179 | 0.1217 | 0.1255 | 0.1293 | 0.1331 | 0.1368 | 0.1406 | 0.1443 | 0.1480 | 0.1517 |
| 0.4 | 0.1554 | 0.1591 | 0.1628 | 0.1664 | 0.1700 | 0.1736 | 0.1772 | 0.1808 | 0.1844 | 0.1879 |
| 0.5 | 0.1915 | 0.1950 | 0.1985 | 0.2019 | 0.2054 | 0.2088 | 0.2123 | 0.2157 | 0.2190 | 0.2224 |
Step 2: Take the area you just found in step 2 and add .500. That’s because the area in the right-hand z-table is the area between the mean and the z-score. You want the entire area up to that point, so:
.5000 + .1772 = .6772.
Step 3: Subtract from 1 to get the tail area:
1 – .6772 = 0.3228.
That’s it!
One Tailed Test or Two: References
Gonick, L. (1993). The Cartoon Guide to Statistics. HarperPerennial.
Heath, D. (2002). An Introduction to Experimental Design and Statistics for Biology. CRC Press.
IDRE: FAQ: What are the differences between one-tailed and two-tailed tests? Retrieved May 27, 2018 from: https://stats.idre.ucla.edu/other/mult-pkg/faq/general/faq-what-are-the-differences-between-one-tailed-and-two-tailed-tests/