Statistics Definitions > Population variance
What is population variance?
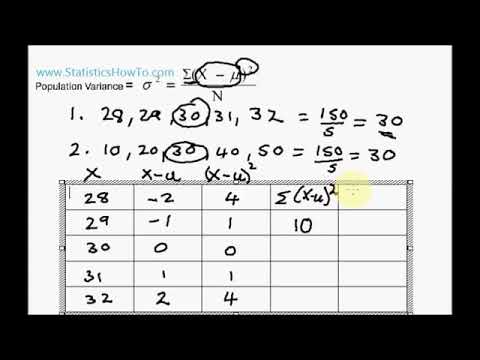
Population variance tells us how data points in a population are spread out. It is the average of the distances from each data point in the population to the mean, squared.
The square root of the population variance is called the population standard deviation, which represents the average distance from the mean.
Watch the video for an overview of the population variance, or read on below.
Can’t see the video? Click here to watch it on YouTube.
Formula and example
Population variance (σ2) can be calculated using the following formula:
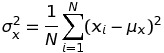
Where
- N is the population size,
- xi are data points,
- μ is the population mean,
- ∑ is summation notation (i.e., add them all up!)
Example question: Find the variance of the age of children in a family of five children aged 16, 11, 9, 8, and 1:
- Find the mean, μx:
μ = 9. - Subtract each data point from the mean, then square the result:
- (16-9)2 = 49
- (11-9)2 = 4
- (9-9)2 = 0
- (8-9)2 = 1
- (1-9)2 = 64.
- Add up all of the squared differences from Step 2:
- (16-9)2 + (11-9)2 + (9-9)2 + (8-9)2+ (1-9)2 = 118.
- Divide Step 3 by the number of items. 118/5 gives a result of 23.6.
Properties of Population Variance
Properties include:
- Additivity: The population variance of the sum of two independent random variables is equal to the sum of their individual variances. For example, if random variables X and Y have variances σ2X and σ2Y, then the variance of the random variable Z = X + Y is σ2Z = σ2X + σ2Y.
- Non-negativity: Pop. variance is always non-negative because squared deviations are non-negative.
- Scale Invariance: Population variance is not affected by units of measurement. For example, the variance is the same whether you measure in feet or inches.
Unchanged with constants: The pop. variance remains unchanged if a constant value is added to each data point. For example, if a different weight system is used, the variance will not be affected. - Zero Variance: When dealing with identical data points, σ2 = 0, because the spread is zero. In other words, all the points are in the same place, so their positions don’t vary.
- Adding a constant: If you add a constant to every data point the σ2 remains unchanged. For instance, suppose you study the birth years of senior citizens in New York and decide to switch calendars from the standard Gregorian one to a calendar where 1900 was year 1, the σ2 would remain the same.
The population variance is a parameter of the population, and is not dependent on research methods or sampling practices.
Differences Between Population Variance and Sample Variance
The sample variance is an estimate of σ2, and is very useful in situations where calculating the population variance would be too cumbersome. The only differences in the way the sample variance is calculated is that the sample mean is used, the deviations is summed up over the sample, and the sum is divided by n-1 (Why use n-1?). When calculating sample variance, n is the number of sample points (vs N for population size in the formula above).
Different samples or experiments are likely to result in different sample variances. However, if your samples are representative, the sample variances should provide good estimates of the population variance and be close to each other. This means that the sample variance is an unbiased estimator of the population variance; an unbiased estimator is a statistic that is, on average, equal to the population parameter that it is trying to estimate. In contrast, the average squared deviation from the sample mean is a biased estimator of the population variance, although it is a consistent one [1]; consistency is where the estimator becomes increasingly accurate with larger sample sizes.