What is a Margin of Error?
A margin of error tells you how many percentage points your results will differ from the real population value. For example, a 95% confidence interval with a 4 percent margin of error means that your statistic will be within 4 percentage points of the real population value 95% of the time.
However, there’s a little more to the formal definition. The margin of error is defined a the range of values below and above the sample statistic in a confidence interval. The confidence interval is a way to show what the uncertainty is with a certain statistic (i.e. from a poll or survey).
For example, a poll might state that there is a 98% confidence interval of 4.88 and 5.26. So we can say that if the poll is repeated using the same techniques, 98% of the time the true population parameter (parameter vs. statistic) will fall within the interval estimates (i.e. between 4.88 and 5.26) 98% of the time.
Statistics Aren’t Always Right!

The idea behind confidence levels and margins of error is that any survey or poll will differ from the true population by a certain amount. However, confidence intervals and margins of error reflect the fact that there is room for error. So although 95% or 98% confidence with a 2 percent Margin of Error might sound like a very good statistic, room for error is built in, which means sometimes statistics are wrong.
For example, a Gallup poll in 2012 (incorrectly) stated that Romney would win the 2012 election with Romney at 49% and Obama at 48%. The stated confidence level was 95% with a margin of error of ± 2. We can conclude that the results were calculated to be accurate to within 2 percentages points 95% of the time.
In comparison, the real results from the election were: Obama 51%, Romney 47%. So this result was outside the range of the Gallup poll’s margin of error (2 percent). In addition to statistics being wrong, polls can be wrong as well.
Back to Top
How to Calculate Margin of Error
As an example, a poll might report that a certain candidate is going to win an election with 51 percent of the vote. Plus, the confidence level is 95 percent and the error is 4 percent. If we assume that the poll was repeated using the same techniques, then the pollsters would expect the results to be within 4 percent of the stated result (51 percent) 95 percent of the time. In other words, 95 percent of the time they would expect the results to be between:
- 51 – 4 = 47 percent and
- 51 + 4 = 55 percent.
The margin of error can be calculated in two ways, depending on whether you have parameters from a population or statistics from a sample:
- Margin of error (parameter) = Critical value x Standard deviation for the population.
- Margin of error (statistic) = Critical value x Standard error of the sample.
How to Calculate Margin of Error: Steps
Step 1: Find the critical value. The critical value is either a t-score or a z-score. If you aren’t sure which score you should be using, see: T-score vs z-score. However, in general, for small sample sizes (under 30) or when you don’t know the population standard deviation, use a t-score. Otherwise, use a z-score.
Step 2: Find the Standard Deviation or the Standard Error. So although these are essentially the same thing, only you must know your population parameters in order to calculate standard deviation. Otherwise, calculate the standard error.
Step 3: Multiply the critical value from Step 1 by the standard deviation or standard error from Step 2. For example, if your CV is 1.95 and your SE is 0.019, then:
1.95 * 0.019 = 0.03705
Example question: 900 students were surveyed and had an average GPA of 2.7 with a standard deviation of 0.4. Calculate the margin of error for a 90% confidence level:
- The critical value is 1.645 (see this video for the calculation)
- The standard deviation is 0.4 (from the question), but as this is a sample, we need the standard error for the mean. The formula for the SE of the mean is standard deviation / √(sample size), so: 0.4 / √(900) = 0.013.
- 1.645 * 0.013 = 0.021385
That’s how to calculate margin of error!
Back to Top
Tip: You can use the t-distribution calculator on this site to find the t-score. In addition, the variance and standard deviation calculator will calculate the standard deviation from a sample.
Margin of Error for a Proportion
The formula is a little different for proportions:
![]()
Where:
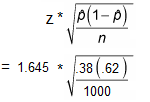
Example question: 1000 people were surveyed and 380 thought that climate change was not caused by human pollution. Find the MoE for a 90% confidence interval.
Step 1: Find P-hat by dividing the number of people who responded positively. “Positively” in this sense doesn’t mean that they gave a “Yes” answer; It means that they answered according to the statement in the question. In this case, 380/1000 people (38%) responded positively.
Step 2: Find the z-score that goes with the given confidence interval. But, you’ll need to reference this chart of common critical values. A 90% confidence interval has a z-score (a critical value) of 1.645.
Step 3: Insert the values into the formula and solve:

= 1.645 * 0.0153
= 0.0252
Step 4: Turn Step 3 into a percentage:
0.0252 = 2.52%
In conclusion, the margin of error is 2.52%.
Plus, check out our Youtube channel for video tips on statistics!
References
Moore, D. S. and McCabe G. P. Introduction to the Practice of Statistics. New York: W. H. Freeman, p. 443, 1999.