< Probability and Statistics < Confidence Interval
Contents (Click to Skip to Section)
- What is a Confidence Interval?
- How to Find a Confidence Interval by Hand:
- How to Find a Confidence Interval using Technology
- History of Confidence Intervals
What is a Confidence Interval
A confidence interval is an estimate of a statistic, plus and minus a variation in that estimate. For example, a voting poll might give a result of 3% for an unpopular candidate plus or minus 2%. It represents how much uncertainty there is with an estimate.
A confidence interval represents a range of values that are likely to include a population parameter. For instance, if you want to know the mean weight of all adults in the United States, you could take a sample of 250 adults and measure their weights. The sample’s mean height would serve as a “point estimate” of the population average; a point estimate is a number used to estimate a population parameter, such as the mean or the standard deviation; in the above image that statistic is “3”.
However, the sample mean might not precisely match the population average. In this case, a confidence interval can help estimate the range of values that probably include the population average. In the above image, the range of values is from 1 to 5.
A more technical definition
More precisely, a confidence interval is a range of likely values for the population parameter based on a point estimate (e.g., the sample mean), a confidence level (e.g., 95%) and the sampling variability or standard error of the point estimate.
Usually, analysts will include a 95% or 99% confidence level with results. For example, they might report a mean of 100 with a 95% confidence interval of between 95 to 105. This tells us that they are 95% confident that the true mean lies between 95 and 105. Should someone else repeat the experiment, 95% of the time the mean will fall into that interval.
Real life example
A 2008 Gallup survey found that TV ownership may be good for wellbeing. The results from the poll stated that the confidence level was 95% +/-3, which means that if Gallup repeated the poll over and over, using the same techniques, 95% of the time the results would fall within the published results. The 95% is the confidence level and the +/-3 is called a margin of error. The article reported, “For the European data, one can say with 95% confidence that the true population for wellbeing among those without TVs is between 4.88 and 5.26.” The confidence interval here is “between 4.88 and 5.26.“
The fact that televisions are connected with wellbeing may come as a surprise, especially since we often view television-watching as being associated with an unhealthy couch potato lifestyle. But the results of the analysis only tell us that there is something about TV ownership that is good for wellbeing — it doesn’t tell us exactly what that “something” is. It could be an association with wealth, access to entertainment, or some other factor. In addition, it doesn’t say that watching TV is good for us — just that owning one is. Thus, we shouldn’t take too much stock in individual study results — even if those results are highly confident.
Confidence Intervals vs. Confidence Levels
- Confidence levels are expressed as a percentage (for example, a 95% confidence level). It means that should you repeat an experiment or survey over and over again, 95% of the time your results will match the results you get from a population (in other words, your statistics would be sound!).
- Confidence intervals are usually numbers. For example, you survey a group of pet owners to see how many cans of dog food they purchase a year. You test your statistic at the 99% confidence level and get a confidence interval of (200, 300). That means you think they buy between 200 and 300 cans a year. You’re super confident (99% is a very high level!) that your results are sound, statistically.
| Feature | Confidence interval | Confidence level |
|---|---|---|
| Definition | A range of values that probably contains a population parameter | The probability that the confidence interval contains the population parameter |
| Calculation | Uses sample size, standard deviation of the sample, and desired level of confidence | Usually chosen by the researcher |
| Interpretation | Indicates the range of values that are likely to be true for the population | Indicates the probability that the confidence interval contains the true population parameter |
Confidence Interval For a Sample: Overview
When you don’t know anything about a population’s behavior (i.e. you’re just looking at data for a sample), you need to use the t-distribution to find the confidence interval. That’s the vast majority of cases: you usually don’t know population parameters, otherwise you wouldn’t be looking at statistics! The confidence interval tells you how confident you are in your results. With any survey or experiment, you’re never 100% sure that your results could be repeated. If you’re 95% sure, or 98% sure, that’s usually considered “good enough” in statistics. That percentage of sureness is the confidence interval.
Steps
If you have one small set of data (under 30 items), you’ll want to use the t-distribution instead of the normal distribution to construct your confidence interval. Example Question:
A group of 10 foot surgery patients had a mean weight of 240 pounds. The sample standard deviation was 25 pounds. Find a confidence interval for a sample for the true mean weight of all foot surgery patients. Use a 95% CL.
The formula you’re going to use is:
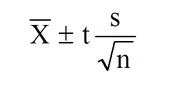
where:
- t = the t-score (from the t-distribution table, shown in Steps 1 through 3 below),
- s = the sample standard deviation,
- n = the sample size,
- x̄ = the sample mean.
Steps:
- Subtract 1 from your sample size. 10 – 1 = 9. This gives you degrees of freedom, which you’ll need in step 3.
- Subtract the confidence level from 1, then divide by two. (1 – .95) / 2 = .025
- Look up your answers to step 1 and 2 in the t-distribution table. For 9 degrees of freedom (df) and α = 0.025, my result is 2.262.
df α = 0.1 0.05 0.025 0.01 0.005 0.001 0.0005 ∞ tα=1.282 1.645 1.960 2.326 2.576 3.091 3.291 1 3.078 6.314 12.706 31.821 63.656 318.289 636.578 2 1.886 2.920 4.303 6.965 9.925 22.328 31.600 3 1.638 2.353 3.182 4.541 5.841 10.214 12.924 4 1.533 2.132 2.776 3.747 4.604 7.173 8.610 5 1.476 2.015 2.571 3.365 4.032 5.894 6.869 6 1.440 1.943 2.447 3.143 3.707 5.208 5.959 7 1.415 1.895 2.365 2.998 3.499 4.785 5.408 8 1.397 1.860 2.306 2.896 3.355 4.501 5.041 9 1.383 1.833 2.262 - Divide your sample standard deviation by the square root of your sample size. 25 / √(10) = 7.90569415
- Multiply step 3 by step 4. 2.262 × 7.90569415 = 17.8826802
- For the lower end of the range , subtract step 5 from the sample mean. 240 – 17.8826802 = 222.117
- For the upper end of the range, add step 5 to the sample mean. 240 + 17.8826802 = 257.883
Small sample example 2
Example problem: Construct a 98% Confidence Interval based on the following data: 45, 55, 67, 45, 68, 79, 98, 87, 84, 82.
- Find the sample mean, μ and standard deviation, σ (try our standard deviation calculator) for the data.
- σ: 18.172.
- μ: 71
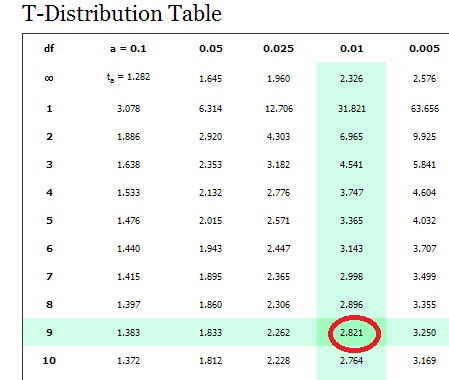
- Subtract 1 from your sample size to find the degrees of freedom (df). We have 10 numbers listed, so our sample size is 10, so our df = 9. Set this number aside.
- Subtract the confidence level from 1, then divide by two. This is your alpha level. (1 – .98) / 2 = .01
- Look up df (Step 2) and α (Step 3) in the t-distribution table. For df = 9 and α = .01, the table gives us 2.821.
- Divide your std dev (step 1) by the square root of your sample size. 18.172 / √(10) = 5.75
- Step 6: : Multiply step 4 by step 5. 2.821 × 5.75 = 16.22075
- Step 7: For the lower end of the range , subtract step 6 from the mean (Step 1). 71 – 16.22075 = 54.77925
- Step 8: For the upper end of the range, add step 6 to the mean (Step 1). 71 + 16.22075 = 87.22075
Confidence Interval with the Normal Distribution / Z-Distribution
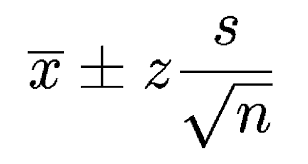
If you don’t know your population mean (μ) but you do know the standard deviation (σ), you can find a confidence interval for the population mean, with the formula: x̄ ± z * (σ / √n), Where
- x̄ = the sample mean,
- z = z-score,
- σ = standard deviation,
- n – sample size.
Example problem: Construct a 95% confidence interval an experiment that found the sample mean temperature for a certain city in August was 101.82, with a population standard deviation of 1.2. There were 6 samples in this experiment.
- Subtract the confidence level (Given as 95 percent in the question) from 1 and then divide the result by two. This is your alpha level, which represents the area in one tail. (1 – .95) / 2 = .025
- Subtract your result from Step 1 from 1 and then look that area up in the middle of the z-table to get the z-score:
- 1 – 0.025 = 0.975
- z score = 1.96.
- Plug the numbers into the second part of the formula and solve: z* σ / (√n) = 1.96 * 1.2/√(6) = 1.96 * 0.49 = 0.96
- For the lower end of the range, subtract step 3 from the mean. 101.82 – 0.96 = 100.86
- For the upper end of the range, add step 3 to the mean. 101.82 + 0.96 = 102.78. The CI is (100.86,102.78)
How to Find a Confidence Interval for a Proportion
When we talk about a confidence interval (CI), we’re dealing with data.
For example, let’s say the manager for that job you applied for told you he would get back with you in a “couple of days.” A couple of days could mean two. Or three. Or there might be a paperwork backlog and it could be a week. It definitely doesn’t mean in an hour. So your CI would probably be between 2 and 4 days.
Perhaps the trickiest part of CIs is recognizing the various parts needed for the formula, like z a/2.
Example Question: 510 people applied to the Bachelor’s in Elementary Education program at Florida State College. Of those applicants, 57 were men. Find the 90% CI of the true proportion of men who applied to the program.
- Read the question carefully and figure out the following variables:
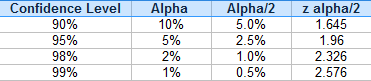
- Find z α/2. You don’t have to look this up in the z-table every time, you can find common ones in the table below.
According to the table, for a 90% CI, z α/2 = 1.645. - p-hat: Divide the proportion given (i.e. the smaller number)by the sample size. 57/510 = 0.112
- q-hat: To find q-hat, subtract p-hat (from directly above) from 1. This gives: 1 – 0.112 = 0.888

Common confidence levels and corresponding z α/2. - Find z α/2. You don’t have to look this up in the z-table every time, you can find common ones in the table below.
- Multiply p-hat by q-hat (from Step 1). 0.112 x 0.888 = 0.099456
- Divide step 2 by the sample size. 0.099456 / 510 = 0.000195011765
- Take the square root of step 3: sqrt(0.000195011765) = 0.0139646613
- Multiply step 4 by z a/2: 0.0139646613 x 1.645 = 0.023.
- For the lower percentage, subtract step 5 from p-hat. 0.112 – 0.023 = 0.089 = 8.9%.
- For the upper percentage, add step 5 to p-hat. 0.112 + 0.023 = 13.5%. This next method involves plugging in numbers into the actual formula. You’ll get the same results if you use the “formula free” method above or if you use the steps below.
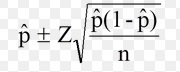
- Confidence intervals for a proportion are calculated using the following formula:
 The formula might look daunting, but all you really need are two pieces of information: the z-score and the P-hat. You should be familiar with looking up z-scores from previous sections on the normal distribution and P-hat is just dividing the number of events by the number of trials. Once you’ve figured those two items out, the rest is basic math.
Example 2: Steps
Example question: Calculate a 95% confidence interval for the true population proportion using the following data: Number of trials(n) = 160 Number of events (x) = 24
Step 1: Divide your confidence level by 2: .95/2 = 0.475.
Step 2: Look up the value you calculated in Step 1 in the z-table and find the corresponding z-value. The z-value that has an area of .475 is 1.96. 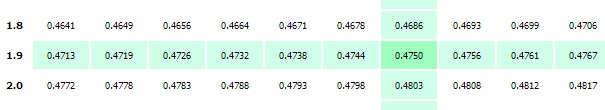
Step 3: Divide the number of events by the number of trials to get the “P-hat” value: 24/160 = 0.15. Step 4: Plug your numbers into the formula and solve:
- 0.15 ± (1.96) √ ((0.15(1 – 0.15) / 160))=
- 0.15 ± (1.96) √ ((0.15(0.85)/160))=
- 0.15 ± (1.96) √ ((0.1275)/160))=
- 0.15 ± (1.96) √ (0.000796875)=
- 0.15 ± (1.96) 0.0282289744765905=
- 0.15 – 0.0553 = 0.0947 ← this is your lower confidence interval for a proportion
- 0.15 + 0.0553 = 0.2053 ←this is your upper confidence interval for a proportion
Your answer can be expressed as: (0.0947,0.2.053).
Two Populations (Proportions)
Finding confidence intervals for two populations can look daunting, especially when you take a look at the ugly equation below.  It looks a lot worse than it is, because the right side of the equation is actually a repeat of the left! Finding confidence intervals for two populations can be broken down to three steps. Example question: A study revealed that 65% of men surveyed supported the war in Afghanistan and 33% of women supported the war. If 100 men and 75 women were surveyed, find the 90% confidence interval for the data’s true difference in proportions.
- Find the following variables from the information given in the question: n1 (population 1)=100
- Phat1 (population 1, positive response): 65% or 0.65 Qhat1 (population 1, negative response): 35% or 0.35 n2(population 2)=75 Phat2 (population 2, positive response): 33% or 0.33 Qhat2 (population 2, negative response): 67% or 0.67
- Find zα/2 (If you’ve forgotten how to find α/2, see the directions in: How to Find a Confidence Interval for a Proportion above) zα/2=0.13
- Enter your data into the following formula and solve:

If formulas scare you, here’s the step-by-step to solve the equation (refer back to step 1 for the variables):
- multiply phat1 and qhat1 together (.65 x .35 = .2275)
- divide your answer to (1) by n1. Set this number aside. (.2275 x 100=.00275)
- multiply phat2 and qhat2 together (.33 x .67=.2211).
- divide your answer to (3) by n2 (.2211/75=.002948).
- Add (3) and (4) together (.00275 + .002948=.005698)
- Take the square root of (5): (sqrt.005698=.075485)
- Multiply (6) by zα/2 found in Step 2. (.075485 x 0.13=.0098). Set this number aside.
- Subtract phat2 from phat1 (.65-.33=.32).
- Subtract (8) from (7) to get the left limit (.32-0.0098 = 31.9902)
- Add (7) to (8) to get the right limit (.32+.0.0098=32.0098)
That’s it!
Confidence Interval for the Mean in Excel
A confidence interval for the mean is a way of estimating the true population mean. Instead of a single number for the mean, a confidence interval gives you a lower estimate and an upper estimate.
For example, instead of “6” as the mean you might get {5,7}, where 5 is the lower estimate and 7 is the upper. The narrower the estimate, the more precise your estimate is. The equations involved in statistics often involve a lot of minor calculations (such as summation), plus you would also need to calculate the margin of error and the mean of the sample.
It’s very easy for errors to slip in if you calculate the confidence interval by hand. However, Excel can calculate the mean of the sample, the margin or error and confidence interval for the mean for you. All you have to do is provide the data —which for this technique must be a sample greater than about 30 to give an accurate confidence interval for the mean.
Example problem: Calculate the 95 percent confidence interval for the mean in Excel using the following sample data: 2, 5, 78, 45, 69, 100, 34, 486, 34, 36, 85, 37, 37, 84, 94, 100, 567, 436, 374, 373, 664, 45, 68, 35, 56, 67, 87, 101, 356, 56, 31.
- Type your data into a single column in Excel. For this example, type the data into cells A1:A31.
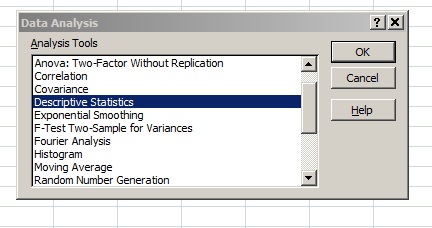
- Click the “Data” tab, then click “Data Analysis,” then click “Descriptive Statistics” and “OK.” If you don’t see Data Analysis, load the Excel data analysis toolpak.

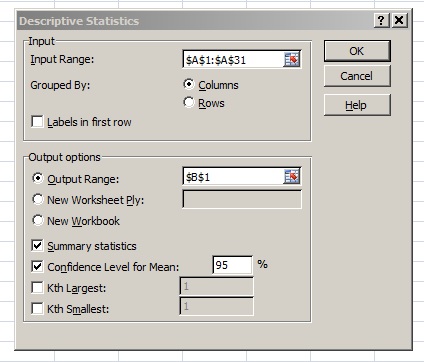
- Enter your input range into the Input Range box. For this example, your input range is “A1:A31”.
- Type an output range into the Output Range box. This is where you want your answer to appear. For example, type “B1.”
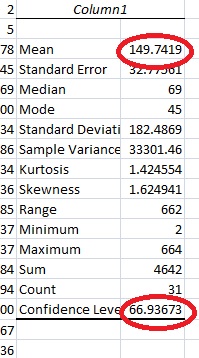
- Click the “Summary Statistics” check box and then place your chosen confidence level into the ‘Confidence Level for Mean’ check box. For this example, type “95”.

- Click “OK. “
-
Microsoft Excel will return the confidence interval for the mean and the margin of error for your data. For this sample, the mean (Xbar) is 149.742 and the margin of error is 66.9367. So the mean has a lower limit of 149.742-66.936 and an upper limit of 149.742+66.936.
 That’s it!
Warning: A 99 percent confidence interval doesn’t mean that there’s a 99 percent probability that the calculated interval has the actual mean. Your sample is either going to contain the actual mean, or it isn’t. Over the long-term, if you ran tests on many, many samples, there is a 99 percent probability that the calculated intervals would contain the true mean.
TI 83 Confidence Interval: Two Populations
Statistics about two populations is incredibly important for a variety of research areas. For example, if there’s a new drug being tested for diabetes, researchers might be interested in comparing the mean blood glucose level of the new drug takers versus the mean blood glucose level of a control group. The confidence interval(CI) for the difference between the two population means is used to assist researchers in questions such as these.
The TI 83 allows you to find a CI for the difference between two means in a matter of a few keystrokes.
Example problem: Find a 98% CI for the difference in means for two normally distributed populations with the following characteristics: 1 = 88.5 σ1 = 15.8 n1 = 38 2 = 74.5 σ2= 12.3 n2 = 48
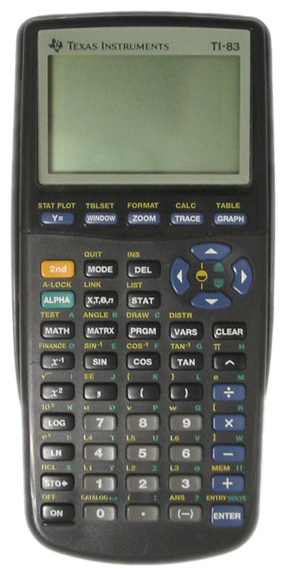
Step 1: Press STAT, then use the right arrow key to highlight TESTS. 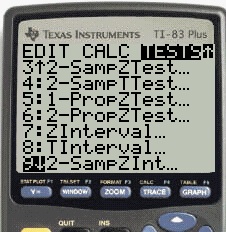 Step 2: Press 9 to select 2-SampZInt….
Step 3: Right arrow to Stats and then press ENTER. Enter the values from the problem into the appropriate rows, using the down arrow to switch between rows as you complete them. 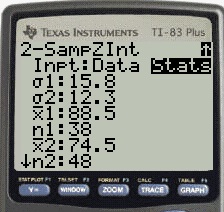
Step 4: Use the down arrow to select Calculate then press ENTER. 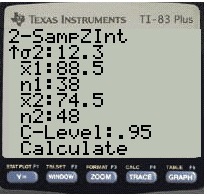
The answer displayed is (6.7467, 21.253). We’re 98% sure that the difference between the two means is between 6.7467 and 21.253.
That’s it!
How to Find a Confidence Interval for Population Proportion, p on the TI 83
Watch the video for an overview of finding the confidence interval, or read on below.
Example problem: A recent poll shows that 879 of 1412 Americans have had at least one caffeinated beverage in the last week. Construct a 90% confidence interval for p, the true population proportion. Note:
- “x” is the number of successes and must be a whole number. Successes in this question is how many Americans have had at least one caffeinated beverage (879). If you are given p̂ instead (the sample proportion), multiply p̂ by n to get x (because x=n* p̂).
- “n” is the number of trials.
Step 1: Press STAT.
Step 2: Right arrow over to “TESTS.”
Step 3: Arrow down to “A:1–PropZInt…” and then press ENTER.
Step 4: Enter your x-value: 879.
Step 5: Arrow down and then enter your n value: 1412.
Step 6: Arrow down to “C-Level” and enter .90. This is your confidence level and must be entered as a decimal.
Step 7: Arrow down to calculate and press ENTER. The calculator will return the range (.6013, .64374) That means the 98 percent CI for the population proportion is between 0.6013 and .64374.
Tip: Instead of arrowing down to select A:1–PropZInt…, press Alpha and MATH instead. Back to Top
How to Find a Confidence Interval on the TI 83 for the Population Mean
If you don’t know how to enter data into a list, you can find the information in this article on TI 83 cumulative frequency tables. Watch the video for an overview of how to do this, or read on below.

Can’t see the video? Click here to watch it on YouTube.
Example problem: 40 items are sampled from a normally distributed population with a sample mean x̄ of 22.1 and a population standard deviation(σ) of 12.8. Construct a 98% confidence interval for the true population mean.
- Press STAT, then right arrow over to “TESTS.”
- Press 7 for “Z Interval.”
- Arrow over to “Stats” on the “Inpt” line and press ENTER to highlight and move to the next line, σ.
- Enter 12.8, then arrow down to x̄.
- Enter 22.1, then arrow down to “n.”
- Enter 40, then arrow down to “C-Level.”
- Enter .98. Arrow down to “calculate” and then press ENTER. The calculator will give you the result of (17.392, 26.808) meaning that your 98% confidence interval is 17.392 to 26.808. This is the same as: 17.392 > μ > 26.808.
How to Find a Confidence Interval for the Mean on the TI 89
Example problem #1 (known standard deviation): Fifty students at a Florida college have the following grade point averages: 94.8, 84.1, 83.2, 74.0, 75.1, 76.2, 79.1, 80.1, 92.1, 74.2, 64.2, 41.8, 57.2, 59.1, 65.0, 75.1, 79.2, 95.0, 99.8, 89.1, 59.2, 64.0, 75.1, 78.2, 95.0, 97.8, 89.1, 65.2, 41.9, 55.2. Find the 95% confidence interval for the population mean, given that σ = 2.27.
- Press APPS and scroll to Stats/List Editor. ENTER.
- Press F1 then 8. This clears the list editor.
- Press ALPHA ) 9 2 to name the list “CI2.”
- Enter your data in a list. Follow each number with the ENTER key: 94.8, 84.1, 83.2, 74.0, 75.1, 76.2, 79.1, 80.1, 92.1, 74.2, 64.2, 41.8, 57.2, 59.1, 65.0, 75.1, 79.2, 95.0, 99.8, 89.1, 59.2, 64.0, 75.1, 78.2, 95.0, 97.8, 89.1, 65.2, 41.9, 55.2.
- Press F4 then 1.
- Enter “ci” in the “List” box: ALPHA key then ) 9 2.
- Enter 1 in the frequency box. Press ENTER. This should give you the mean (xbar, the first in the list) = 75.033.
- Press ENTER. Press 2nd F7 1 ENTER. This brings up the z-distribution menu.
- Press the right arrow key then the down arrow to select a “Data Input Method” of “Stats.” Press ENTER.
- Enter your σ from the question (in our case, 2.27), xbar from Step 7 (75.3033), n = 30 and the Confidence Interval from the question (in our example, it’s .95).
- Press ENTER and read the results. The “C Int” is {74.49,76.123}. This means we are 95% confident that the population mean falls between 74.49 and 76.123.
That’s it!
Example problem #2 (unknown standard deviation): A random sample of 30 students at a Florida college has the following grade point averages: 59.1, 65.0, 75.1, 79.2, 95.0, 99.8, 89.1, 65.2, 41.9, 55.2, 94.8, 84.1, 83.2, 74.0, 75.1, 76.2, 79.1, 80.1, 92.1, 74.2, 59.2, 64.0, 75.1, 78.2, 95.0, 97.8, 89.1, 64.2, 41.8, 57.2. What is the 90% confidence interval for the population mean?
- Press APPS. Scroll to the Stats/List Editor and press ENTER.
- Press F1 8 to clear the editor.
- Press ALPHA ) 9 to name the list “CI.”
- Enter your data in a list. Follow each number with the ENTER key: 59.1, 65.0, 75.1, 79.2, 95.0, 99.8, 89.1, 65.2, 41.9, 55.2, 94.8, 84.1, 83.2, 74.0, 75.1, 76.2, 79.1, 80.1, 92.1, 74.2, 59.2, 64.0, 75.1, 78.2, 95.0, 97.8, 89.1, 64.2, 41.8, 57.2.
- Press F4 1.
- Enter “ci” in the List box: Press ALPHA ) 9.
- Enter1 in the frequency box. Press ENTER. This should give you the sample standard deviation, sx = 15.6259, n = 30, and x (the sample mean) = 75.033.
- Press ENTER. Press 2nd F2 2.
- Press the right arrow key then the down arrow to select a “Data Input Method” of “Stats.” Press ENTER.
- Enter your x, sx and n from Step 7. In our example, sx = 15.6259. n = 30 and x = 75.033. Enter the Confidence Interval from the question (in our example, it’s .9).
- Press ENTER and read the results. The C Int is {70.19,79.88} which means that we are 90% confident that the population mean falls between 70.19 and 79.88.
That’s it!
Tip: If you know σ, use ZInterval instead of TInterval.
How to find a Confidence Interval for a Proportion on the TI 89
Example problem #1: In a simple random sample of 295 students, 59.4% of students agreed to a tuition increase to fund increased professor salaries. What is the 95% CI for the proportion in the entire student body who would agree?
- Press APPS and scroll down to Stats/List Editor. Press ENTER. If you don’t see the Stats/List editor, download it HERE from the TI-website. You’ll need the graphlink cable that came with your calculator to transfer the software.
- Press 2nd F2 5 for the 1-PropZInt menu.
- Figure out your “successes.” Out of 295 people, 59.4% said yes, so .694 × 295 = 175 people.
- Enter your answer from Step 3 into the Successes,x box: 175.
- Scroll down to n. Enter 295, the number in the sample.
- Scroll down to C Level. Enter the given confidence level. In our example, that’s .95. Press ENTER twice.
- Read the result. The calculator returns the result C Int {.5372, .6493}. This means that you are 95% confident that between 54% and 65% of the student body agree with your decision.
Tip: If you are asked for a folder when entering the Stats Editor, just press Enter. It doesn’t matter which folder you use.
Warning: Make sure your round your “success” entries to the nearest integer to avoid a domain error.
Example problem #2: A recent poll in a simple random sample of 986 women college students found that 699 agreed that textbooks were too expensive. Out of 921 men surveyed by the same manner, 750 thought that textbooks were too expensive. What is the 95% confidence interval for the difference in proportions between the two populations?
Step 1: Press APPS, scroll to the Stats/List Editor, and press ENTER.
Step 2: Press 2nd F2 6 to reach 2-PropZint.
Step 3: Enter your values into the following boxes (Use “women” for population 1 (x1 and n1) and “men” for population 2 (x2 and n2)):
- Successes, x1: 590*
- n1: 796
- Successes, x2: 548
- n2: 800
- C Level: 0.95
Step 4: Press ENTER. Step 5: Read the result. The confidence interval is displayed at the top as C Int { .0119,.10053}. This means that your confidence interval is between 1.19% and 10.05%.
Tip: As long as you keep track of which population is x1/n1 and x2/n2, it doesn’t matter which is entered in which box.
*You must enter a whole number here, or you’ll get ERR:DOMAIN. You’ll come across this common type of problem in elementary stats: find a confidence interval given a large random sample and the number of “successes” in that sample.
The 95% Confidence Interval Explained
The terms confidence level and confidence interval are often confused. A 95% confidence level means is that if the survey or experiment were repeated, 95 percent of the time the data would match the results from the entire population. Sometimes you just can’t survey everyone because of time or cost (think about how much it would cost to do a telephone survey of over 300 million Americans!).Therefore, you take a sample of the population.
Having a 95% confidence level means that you’re almost certain your results are the same as if you had surveyed everyone. A 95% confidence interval gives you a very specific set of numbers for your confidence level. For example, let’s suppose you were surveying a local school to see what the student’s state test scores are. You set a 95% confidence level and find that the 95% confidence interval is (780,900). That means if you repeated this over and over, 95 percent of the time the scores would fall somewhere between 780 and 900.
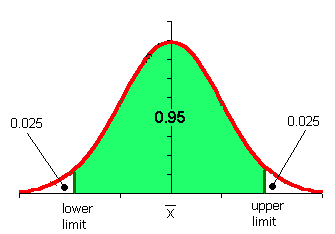
The above image shows a 95% confidence interval on a normal distribution graph. The red “tails” are the remaining 5 percent of the interval. Each tail has 2.5 percent (that’s .025 as a decimal).
You don’t have to draw a graph when you’re working with confidence intervals, but it can help you visualize exactly what you are doing — especially in hypothesis testing.
If your results fall into the red region, then that’s outside of the 95% confidence level that you, as a researcher, set. If you have a small sample or if you don’t know the population standard deviation which in most real-life cases is true), then you’ll find the 95% Confidence Interval with a t-distribution.
Asymmetric Confidence Interval
An asymmetric confidence interval just means that the point estimate doesn’t lie in the exact center of the CI. You can end up with asymmetric CIs for many reasons, including:
- You transform your data (for example, using log transformations).
- You incorporate random error.
- You incorporate systematic bias into the interval:
- A positive systematic bias will increase the right side of the interval.
- A negative systematic bias will increase the left side of the interval.
History of Confidence Intervals
The idea of confidence intervals originated in the early 1930s, thanks to the work of Jerzy Neyman and Egon Pearson, who were Polish-American and English statisticians, respectively. They introduced confidence intervals as a method to quantify the uncertainty surrounding a statistical estimate. Before confidence intervals, statisticians relied on hypothesis testing for making inferences about populations.
Hypothesis testing involves comparing a sample statistic to an assumed population parameter. If the sample statistic differs significantly from the assumed population parameter, the null hypothesis is rejected. However, if the sample statistic does not deviate significantly, the null hypothesis remains unchallenged.
Neyman and Pearson contended that hypothesis testing was insufficient for drawing conclusions about populations, as it failed to provide information about the statistical estimate’s uncertainty. Confidence intervals offer a means to quantify this uncertainty by specifying ranges of values likely to include the true population parameter.
The confidence level represents the probability of the confidence interval containing the actual population parameter.
Nowadays, confidence intervals are widely used across various fields, such as economics, finance, medicine, and social science, proving invaluable for making population inferences. Key figures in the history of confidence intervals include:
- Jerzy Neyman (1894-1980): Polish-American statistician who co-developed the concept of confidence intervals with Egon Pearson.
- Egon Pearson (1895-1980): English statistician who co-developed the concept of confidence intervals with Jerzy Neyman.
- Ronald Fisher (1890-1962): English statistician who pioneered the use of hypothesis testing in statistics.
- William Sealy Gosset (1876-1937): Irish statistician who created the student t-distribution, a commonly used distribution for estimating confidence intervals.
Confidence intervals have significantly impacted the field of statistics as a versatile and powerful tool, applicable in various settings and valuable for making inferences about populations.
More explanations and Definitions: