Statistics Definitions > Tweedie Distribution
What is a Tweedie Distribution?
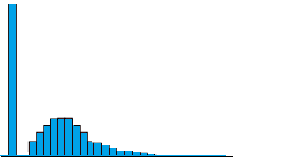
The Tweedie distribution is a special case of an exponential distribution. It can have a cluster of data items at zero (called a “point mass”), which is particularly useful for modeling claims in the insurance industry, in medical/genomic testing, or anywhere else there is a mixture of zeros and non-negative data points. Basically, if you see a histogram with a spike at zero, it’s a possible candidate to be fitted to a Tweedie model.

The Tweedie distribution is actually a family of distributions that are a subset of Exponential Dispersion Models(EDMs). EDMs are two-parameter distributions from the linear exponential family that have a scale parameter φ.
Mean, Variance and Shape
This family of distributions has the following characteristics:
The p in the variance function is an additional shape parameter for the distribution. “p” is sometimes written in terms of the shape parameter α:
p = (α – 2) / (α -1).
Some familiar distributions are special cases of the Tweedie distribution:
- p = 0 : Normal distribution,
- p = 1: Poisson distribution,
- 1 < p < 2: Compound Poisson/gamma distribution,
- p = 2 gamma distribution,
- 2 < p < 3 Positive stable distributions,
- p = 3: Inverse Gaussian distribution / Wald distribution,
- p > 3: Positive stable distributions,
- p = ∞ Extreme stable distributions.
The distribution is not defined for values of “p” from 0 to 1.
The probability density function for the Tweedie family is complex and cannot be expressed in a simple closed form (but it is sometimes expressed as a series of functions). As the distribution mimics other distributions for some values of “p”, you can use the pdf for those functions. For example, if p is 3, you can use the pdf for the inverse Gaussian.
References:
Tweedie, M. C. K. (1984). An index which distinguishes between some important exponential families. In Statistics: Applications and New Directions. Proceedings of the Indian Statistical Institute Golden Jubilee International Conference. (Eds. J. K. Ghosh and J. Roy), pp. 579-604. Calcutta: Indian Statistical Institute.
References
Kotz, S.; et al., eds. (2006), Encyclopedia of Statistical Sciences, Wiley.