You may want to read these articles first:
What is a Confidence Interval?
What is a Binomial Distribution?
What is a Binomial Confidence Interval?
The binomial confidence interval is a measure of uncertainty for a proportion in a statistical population. It takes a proportion from a sample and adjusts for sampling error.
Let’s say you needed a 100(1-α) confidence interval (where α is the significance level) on a certain parameter p for a binomial distribution. Exactly how you would achieve this depends on the values for n (your sample size) and p:
- Large sample size (> 15) and large p (≥ 0.1): The normal approximation method works well (Herson, 2009) unless the proportion is close to 0 or 1 (Razdolsky, 2014). The general rule of thumb is that you can use the normal approximation when n * p and n * q (q is just 1 – p) are greater than 5. For more on this, see: Using the normal approximation to solve a binomial distribution problem.
- Large sample size (> 15) and small p (< 0.1): The Poisson approximation for the binomial is a better choice (Montgomery, 2001).
- Small samples (15 or under): a binomial table should be used to find the binomial confidence interval for p.
All of the formulas associated with a binomial confidence interval work on the assumption of an underlying binomial distribution. In other words, your experiment has a fixed number of trials with two outcomes, a “success” or “failure.” Success and failure are generic terms for two opposing outcomes, which could be yes/no, black/white, voted/didn’t vote, or a myriad of other options,
1. Large N, Large P (Normal Approximation)
For large samples, you can approximate the binomial using a normal distribution. This is justified by the Central Limit Theorem.
One Sample
The formula for the CI on parameter p is:
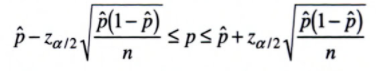
The unbiased point estimator, p is the proportion of “successes” in a Bernoulli trial. As a formula, that’s:
![]()
Z alpha/2 is an alpha level’s z-score for a two tailed test. See: What is Z Alpha/2?
Two Sample
The formula for the difference on p1 – p2 is:

![]()
2. Approximating using the Poisson Distribution
You have a couple of choices here. The first is to use one of the many calculators available online. A good one is this one, which gives you values for a 95% CI. The second option is to use a table, such as the one at the bottom of this article: Table for 95% exact confidence intervals for the Poisson Distribution.
Let’s use an example to show how the table works. You have a small sample of observations (n = 6) from a total population of 10,000. For this low level of occurrence in the population, the Poisson gives a good approximation to the binomial. To find the mean(μ) and the associated confidence interval:
- Locate the 95% low and high values in the table for 95% exact confidence intervals for the Poisson Distribution.. For n = 6, the low is 2.202 and the high is 13.06.
- Divide the numbers you found in the table by the number of population members. In this example, there are 10,000 members, so the confidence interval is:
- 2.202 / 10,000 = 0.00022
- 13.06 / 10,000 = 0.001306
Exact 95% CI Table for the Poisson Distribution
The following table shows the first few values for an exact 95% confidence limit for the Poisson Distribution (adapted from Appendix 1 of Ahlbom’s Biostatistics for Engineers):
| # Observed Events | 95% Low | 95% High |
| 0 | 0.000 | 3.689 |
| 1 | 0.025 | 5.572 |
| 2 | 0.242 | 7.225 |
| 3 | 0.619 | 8.767 |
| 4 | 1.090 | 10.24 |
| 5 | 1.623 | 11.67 |
| 6 | 2.202 | 13.06 |
| 7 | 2.814 | 14.42 |
| 8 | 3.454 | 15.76 |
| 7 | 2.814 | 14.42 |
| 8 | 3.454 | 15.76 |
| 9 | 4.115 | 17.09 |
| 10 | 4.795 | 18.39 |
| 11 | 5.491 | 19.68 |
| 12 | 6.201 | 20.96 |
| 13 | 6.922 | 22.23 |
| 14 | 7.654 | 23.49 |
| 15 | 8.395 | 24.74 |
| 16 | 9.145 | 25.98 |
| 17 | 9.903 | 27.22 |
| 18 | 10.67 | 28.45 |
| 19 | 11.44 | 29.67 |
| 20 | 12.22 | 30.89 |
References
Herson, J. (2009). Data and Safety Monitoring Committees in Clinical Trials. CRC Press.
Montgomery, D. (2001). Introduction to Statistical Quality Control. 4th Edition. Wiley & Sons.
Radolsky, L. (2014). Probability-Based Structural Fire Load. Cambridge University Press.