You may want to read Part 1 and 2 of Intro to Statistics first.
When we perform a survey or experiment, we sometimes want to find out an interval where we can expect to find the majority (95%) of results; the interval that contains 95% of results is called the 95 percent confidence interval.
Contents:
- A Survey Example
- 95 Percent Confidence Interval Formula for Sample Proportions
- What Does the 95 Percent Confidence Interval Tell Us?
95 Percent Confidence Interval: A Survey Example
Let’s say a group of surveyors want to determine what the value of the population parameter might be, based on a sample statistic. For example, a surveyor who gets a sample statistic value of 34% will want to calculate a 95 percent confidence interval surrounding 34% and explain what that interval might tell us about the overall population’s opinions.
We are going to explore the subtleties involved by sending out 1,000 surveyors to survey the same population and see what they come up with and how they should interpret what they come up with. But first we’ll need to set the stage by inventing a population that has certain characteristics that we know, but none of the surveyors know. Our invented community, Artesian Wells, has about 70,000 residents. There is a new public health policy being debated and, since we are omniscient (all-knowing), we know that 40% of the residents agree with the new policy. Only we know this. We want to know what to expect when many, many surveyors randomly sample 1000 people from this population. The survey respondents will be asked whether they “agree” or “disagree” with something, a binomial response. We’ll use proportions rather than percentages, with the proportions rounded to two decimal places.
Figure 3.3 shows us the sampling distribution of what to expect. (Don’t get confused: There are 1,000 random samples, and each sample has a sample size of 1000.)
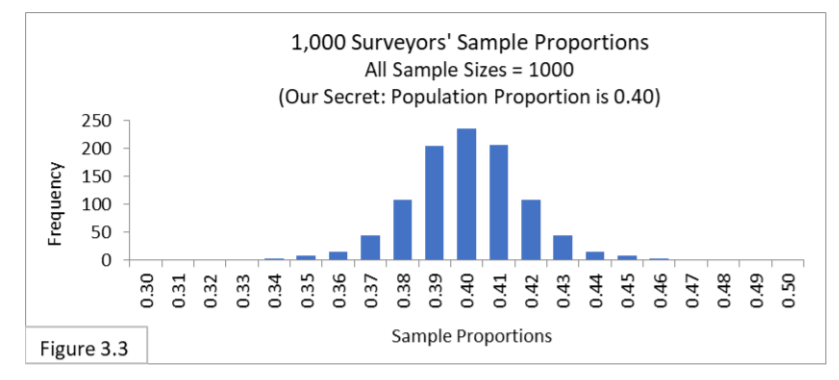
Based on visual inspection, notice that the great majority of the sample proportions are in the interval 0.37 to 0.43. Approximately 950 of the 1,000 sample proportions are contained within the interval 0.37 to 0.43, indicating that 0.37 to 0.43 is the 95 percent confidence interval surrounding the population proportion of 0.40. The formula will give us the same boundary lines. (Feel free to double check.)
We always expect the 95% interval around the population proportion to contain 95% of all sample proportions obtained by random sampling.
Now, we hire 1,000 independent surveyors who converge on the town to do the “agree” or “disagree” survey. All 1,000 surveyors get their own random sample of 1000 residents and calculate their own sample proportion-agree statistic. How does each of the individual surveyors analyze their sample proportion?
95 Percent Confidence Interval Formula for Sample Proportions
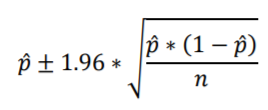
Let’s look at the formula for calculating 95% confidence intervals for sample proportions. It looks much like the formula in the previous section. The variable p with a hat denotes the sample proportion (as opposed to the population proportion). The square root term calculates the Standard Error for the sample proportion. Sample size is again represented by n. As for the constant 1.96, I sometimes round 1.95996…Standard Errors to 2 Standard Errors for ease of calculation; here, I’m being more precise by using 1.96 Standard Errors, which is more common.
Each of the 1,000 surveyors calculates their individual interval using their sample proportion value, and we expect that 95% of the surveyors’ 95 percent confidence intervals will contain the population proportion (0.4 in this example). You might want to reread that sentence a few times, keeping in mind that although we, as know-it-alls, know that the population proportion is 0.4, none of the surveyors have any idea what it is.
It’s in this context that the term “confidence” in “confidence interval” came about: we are confident that 95% of all 95 percent confidence intervals for sample statistic values obtained via random sampling will contain the population statistic value. (But no individual surveyor will know whether their confidence interval contains the population parameter value or not!)
In a nutshell:
- The 1,000 surveyors calculate their individual 95% confidence intervals.
- About 950 of them will have an interval containing the population proportion.
- About 50 of them won’t.
What Does the 95 Percent Confidence Interval Tell Us?
Let’s look at the 95% confidence intervals constructed via the formula by two surveyors: The first got a sample proportion of 0.38, and the second got a sample proportion of 0.34.
Surveyor #1 Result.
Using the formula with a sample proportion of 0.38 and a sample size of 1000, the 95 percent confidence interval is 0.35 to 0.41 (rounded).
Only we, being know-it-alls, know that this 95 percent confidence interval contains the population proportion of 0.4
Surveyor #2 Result.
Using the formula with a sample proportion of 0.34 and a sample size of 1000, the 95 percent confidence interval is 0.31 to 0.37. Only we, being know-it-alls, know that this 95 percent confidence interval does not contain the population proportion of 0.4. Only we know that this surveyor is one of the 5% of unlucky surveyors who just happened to get a misleading random sample. This is called a Type I Error.
In summary,
- We expect the 95 percent confidence interval around the population proportion to contain 95% of all sample proportions obtained by random sampling. We’ve been seeing this all along.
- We expect 95% of all the 95 percent confidence intervals based on random sample proportions to contain the population proportion. We see this for the first time here; more detail is given next.
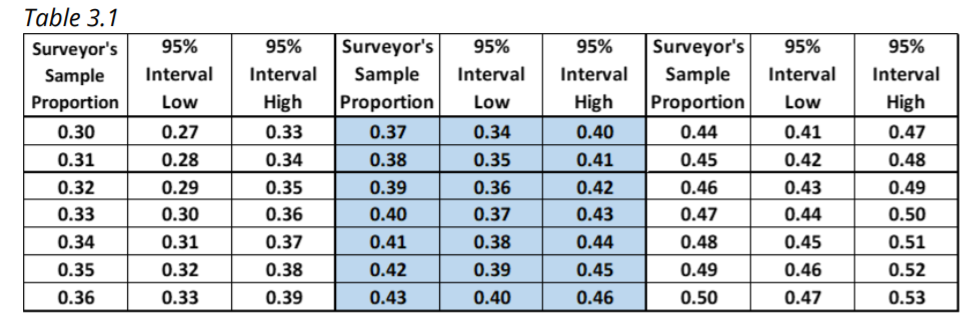
Table 3.1 is divided into three sections, left to right, and shows what the various surveyors will get. Overall, the Table shows the confidence intervals for surveyors with sample proportions of 0.3 through 0.5; sample proportions 0.30 through 0.36 are in the left section, 0.37 through 0.43 are in the middle section (shaded), and 0.44 through 0.50 are in the right section. Notice that the expected 950 surveyors in the middle section (shaded) with sample proportions within the interval of 0.37 to 0.43 also have 95% confidence intervals that contain the population proportion of 0.40. The expected 50 surveyors with sample proportions outside the interval of 0.37 to 0.43—the left and right sections of the Table—do not have 95% confidence intervals that contain the population proportion of 0.40.
Again, in summary, and for emphasis:
- We expect the 95% confidence interval around the population proportion to contain 95% of all sample proportions obtained by random sampling.
- We expect 95% of all the 95% confidence intervals based on random sample proportions to contain the population proportion.
Because of these two facts, we will reach the same conclusion whether we
- check if a sample proportion is outside the 95% interval surrounding a hypothesized population proportion, or
- check if the hypothesized population proportion is outside the 95% interval surrounding a sample proportion.
The analysis can be done either way.
Here’s a quick analogy: Suppose a stamping plant that makes coins was malfunctioning and produced unbalanced (i.e., unfair) coins. Unbeknownst to anyone, these unfair coins favored tails, and the chance of coming up heads is only 0.4. Now say 1,000 people flip these coins 1000 times each, while counting and then determining the proportion of heads. What would the 1,000 peoples’ results be like? What would an analysis of a single coin and its 1000 flips be like? Answer: Just like the survey example above. Just replace the words “agree” and “disagree” with “heads” and “tails”. We expect 95% of the coin-flippers will get 95% confidence intervals that contain 0.4, and 5% of the coin-flippers will get 95% confidence interval that do not contain 0.4. In other words, we expect 95% of the results to be veridical and 5% of the results to be misleading. But no one knows whether their results are veridical or misleading. The reason I use the word “veridical” is because it’s the perfect word: “Coinciding with reality.” I’m using it to mean the opposite of misleading.
Next: Type I and Type II Errors
References
J.E. Kotteman. Statistical Analysis Illustrated – Foundations . Published via Copyleft. You are free to copy and distribute this content.
Kenney, J. F. and Keeping, E. S. “Confidence Limits for the Binomial Parameter” and “Confidence Interval Charts.” §11.4 and 11.5 in Mathematics of Statistics, Pt. 1, 3rd ed. Princeton, NJ: Van Nostrand, pp. 167-169, 1962.