“Z-interval” could refer to either:
- A specific type of confidence interval (see below), or
- A TI-83 calculator option to find a confidence interval for the mean using the Z Interval. If you’re using the TI-83, see this article on confidence intervals for step by step TI-83 Z Interval instructions.
You may want to read this article first: What is a confidence interval?
What is a Z Interval?
A z interval is a specific type of confidence interval which tells you a range where you can expect a particular mean or proportion to fall. It can be calculated from a known standard deviation.
Z-Interval vs. T-Interval
In general, you want to choose to calculate z-intervals when:
- Your sample size is 30 or greater,
- You know the standard deviation of your sample.
When you don’t know the standard deviation and still want to find a confidence interval, calculate a t-interval instead. The concept is the same, except that you use a different table to calculate the interval: the z-table for a z-interval and a t-table for a t-interval. For more on the specific differences between the “T” and “Z”, see: T-scores vs. Z-scores.
How to Calculate the Z Interval
Need help with a homework question? Check out our tutoring page!
A z interval for a mean is given by the formula:
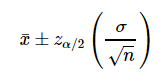
The formula may look a little daunting, but the individual parts are fairly easy to find:
- n is the sample size.
- σ is the standard deviation.
- x̄ is the sample mean
- zα/2 is an alpha level’s z-score for a two tailed test (see note below).
Note: If zα/2 is new to you, read all about zα/2 here. Most of the time, you won’t have to do any calculations because the most common values are already known:
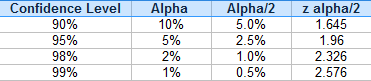
For example, if you’re trying to find a z-interval with a 90% confidence level and a 5% alpha (significance) level, then use 1.645 in the above equation.
Example
Suppose we want to calculate a 95 percent confidence interval for a situation where we know:
- Mean (μ) = 50,
- Standard deviation = 5,
- Number of data points in the sample is 81.
For a 95 % confidence interval, the above table tells us that z0.025 = 1.96.
Now we have all the data to plug into our formula, and our confidence interval will be:
[50- (1.96) (5/9), 50 + (1.96)(5/9)]
We can simplify this to:
[48.91, 51.09]
which is our confidence interval or z interval.
References
Gonick, L. (1993). The Cartoon Guide to Statistics. HarperPerennial.
Everitt, B. S.; Skrondal, A. (2010), The Cambridge Dictionary of Statistics, Cambridge University Press.
Kotz, S.; et al., eds. (2006), Encyclopedia of Statistical Sciences, Wiley.
Pennsylvania State University Department of Statistics Online Programs. STAT 414 Intro Probability Theory. Lesson 30 Confidence Intervals for One Mean. Retrieved from https://newonlinecourses.science.psu.edu/stat414/node/194/ and https://newonlinecourses.science.psu.edu/stat414/node/196/ on May 30, 2018.
Walker, Jerimi Ann. Confidence Intervals for the Mean- By Hand. Retrieved from
https://www.mathbootcamps.com/calculating-confidence-intervals-for-the-mean/ on May 30, 2018.Xie, Yao. Lecture Notes: Confidence Interval. Retrieved from https://www2.isye.gatech.edu/~yxie77/isye2028/lecture7.pdf on May 30, 2018.