Non Normal Distributions > Logistic Distribution
Contents:
What is a Logistic Distribution?
![By Krishnavedala (Own work) [CC0], via Wikimedia Commons](https://www.statisticshowto.com/wp-content/uploads/2016/03/Logisticpdfunction.svg_.png)
The logistic distribution is used for modeling growth, and also for logistic regression. It is a symmetrical distribution, unimodal (it has one peak) and is similar in shape to the normal distribution.
In fact, the logistic and normal distributions are so close in shape (although the logistic tends to have slightly fatter tails) that for most applications it’s impossible to tell one from the other. That said, the logistic distribution is often used because the curve has a relatively simple cumulative distribution formula to work with, compared to the normal distribution.
Why is it Used?
The logistic distribution is mainly used because the curve has a relatively simple cumulative distribution formula to work with. The formula approximates the normal distribution extremely well. Finding cumulative probabilities for the normal distribution usually involves looking up values in the z-table, rounding up or down to the nearest z-score. Exact values are usually found with statistical software, because the cumulative distribution function is so difficult to work with, involving integration: ![]()
Although there are many other functions that can approximate the normal, they also tend to have very complicated mathematical formulas. The logistic distribution, in comparison, has a much simpler CDF formula: 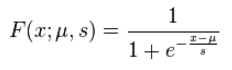
Two parameters define the shape of the distribution:
- The location parameter (μ) tells you where it’s centered on the x-axis.
- The scale parameter (σ) tells you what the spread is. In the above equation, s is a scale parameter proportional to the standard deviation.
The probability density function for the distribution is: 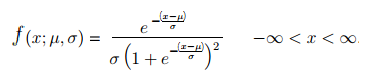
Other Useful Statistics
Fun fact: The United States Chess Federation and the World Chess Federation (FIDE) use the logistic distribution to calculate the relative skill level of chess players. Formerly, they both used the normal distribution.
Stukel distribution
Stukel proposed a two-parameter class of generalized logistic distributions in 1988 [1], with the goal of extending the standard logistic model to improve fit in the noncentral probability regions and include asymmetric deviations in logistic models.
About the Stukel distribution
A Stukel distribution includes skewness into the link function and, according to Stukel, works well for many common applications. Stukel’s models are generalized, which means that many common link models (including symmetric and asymmetric models) can be included in family members. One disadvantage of any Stukel distribution is that when covariates are present, the models can result in improper posterior distributions for many types of noninformative improper priors, including the improper uniform prior for the regression coefficients [2].
Other logistic distribution generalizations
Many other authors have proposed generalizations of the standard logistic distribution including:
- Aranda-Ordaz [3], who proposed two different one-parameter distributions — one for symmetric and one for asymmetric departures.
- Prentice [4], who modeled the expected probability curve with the cumulative distribution function (CDF) of the log F 1m1,2m2 distribution; the log F distributions includes as special cases the logistic distribution, the normal distribution, extreme minimum distribution, extreme maximum distribution, exponential distribution, LaPlace distribution and reflected exponential distribution. Thus, Prentice’s models can handle a range of nonstandard cases.
- Pregibon [5], who defined a family of link functions to include the logit link as a special case.
References
[1] Stukel, T. A. (1988), “Generalized Logistic Models,” Journal of the American Statistical Association, 83, 426–431.
[2] CHEN, M.-H., DEY, D. K. and SHAO, Q.-M. (1999). A new skewed link model for dichotomous quantal response data. J. Amer. Statist. Assoc. 94 1172–1186. MR1731481
[3] Aranda-Ordaz, F. J. 1981. “On Two Families of Transformations to Additivity for Binary Response Data,”. Biometrika, 68: 357–363. [Google Scholar]
[4] Prentice, R. L. 1976. “Generalization of the Probit and Logit Methods for Dose Response Curves,”. Biometrics, 32: 761–768. [Google Scholar]
[5] Pregibon, D. 1980. “Goodness of Link Tests for Generalized Linear Models,”. Applied Statistics, 29: 15–24. [Google Scholar]
Check out our YouTube Channel for hundreds of elementary statistics and probability videos!
What is a Logistic Distribution?
The logistic distribution is used for modeling growth, and also for logistic regression. It is a symmetrical distribution, unimodal (it has one peak) and is similar in shape to the normal distribution.
In fact, the logistic and normal distributions are so close in shape (although the logistic tends to have slightly fatter tails) that for most applications it’s impossible to tell one from the other. That said, the logistic distribution is often used because the curve has a relatively simple cumulative distribution formula to work with, compared to the normal distribution.
Why is it Used?
The logistic distribution is mainly used because the curve has a relatively simple cumulative distribution formula to work with. The formula approximates the normal distribution extremely well. Finding cumulative probabilities for the normal distribution usually involves looking up values in the z-table, rounding up or down to the nearest z-score. Exact values are usually found with statistical software, because the cumulative distribution function is so difficult to work with, involving integration: ![]()
Although there are many other functions that can approximate the normal, they also tend to have very complicated mathematical formulas. The logistic distribution, in comparison, has a much simpler CDF formula:
Two parameters define the shape of the distribution:
- The location parameter (μ) tells you where it’s centered on the x-axis.
- The scale parameter (σ) tells you what the spread is. In the above equation, s is a scale parameter proportional to the standard deviation.
The probability density function for the distribution is:
Other Useful Statistics
Fun fact: The United States Chess Federation and the World Chess Federation (FIDE) use the logistic distribution to calculate the relative skill level of chess players. Formerly, they both used the normal distribution.
Stukel distribution
Stukel proposed a two-parameter class of generalized logistic distributions in 1988 [1], with the goal of extending the standard logistic model to improve fit in the noncentral probability regions and include asymmetric deviations in logistic models.
About the Stukel distribution
A Stukel distribution includes skewness into the link function and, according to Stukel, works well for many common applications. Stukel’s models are generalized, which means that many common link models (including symmetric and asymmetric models) can be included in family members. One disadvantage of any Stukel distribution is that when covariates are present, the models can result in improper posterior distributions for many types of noninformative improper priors, including the improper uniform prior for the regression coefficients [2].
Other logistic distribution generalizations
Many other authors have proposed generalizations of the standard logistic distribution including:
- Aranda-Ordaz [3], who proposed two different one-parameter distributions — one for symmetric and one for asymmetric departures.
- Prentice [4], who modeled the expected probability curve with the cumulative distribution function (CDF) of the log F 1m1,2m2 distribution; the log F distributions includes as special cases the logistic distribution, the normal distribution, extreme minimum distribution, extreme maximum distribution, exponential distribution, LaPlace distribution and reflected exponential distribution. Thus, Prentice’s models can handle a range of nonstandard cases.
- Pregibon [5], who defined a family of link functions to include the logit link as a special case.
References
[1] Stukel, T. A. (1988), “Generalized Logistic Models,” Journal of the American Statistical Association, 83, 426–431.
[2] CHEN, M.-H., DEY, D. K. and SHAO, Q.-M. (1999). A new skewed link model for dichotomous quantal response data. J. Amer. Statist. Assoc. 94 1172–1186. MR1731481
[3] Aranda-Ordaz, F. J. 1981. “On Two Families of Transformations to Additivity for Binary Response Data,”. Biometrika, 68: 357–363. [Google Scholar]
[4] Prentice, R. L. 1976. “Generalization of the Probit and Logit Methods for Dose Response Curves,”. Biometrics, 32: 761–768. [Google Scholar]
[5] Pregibon, D. 1980. “Goodness of Link Tests for Generalized Linear Models,”. Applied Statistics, 29: 15–24. [Google Scholar]
Check out our YouTube Channel for hundreds of elementary statistics and probability videos!