Statistics Definitions > Business Statistics
What is Business Statistics?
Business statistics takes the data analysis tools from elementary statistics and applies them to business. For example, estimating the probability of a defect coming off a factory line, or seeing where sales are headed in the future. Many of the tools used in business statistics are built on ones you’ve probably already come across in basic math: mean, mode and median, bar graphs and the bell curve, and basic probability. Hypothesis testing (where you test out an idea) and regression analysis (fitting data to an equation) builds on this foundation.
Basically, the course is going to be practically identical to an elementary statistics course. There will be slight differences. The questions will have a business feel, as opposed to questions about medicine, social sciences or other non-business subjects. Data samples will likely be business-oriented. Some subjects usually found in a basic stats course (like multiple regression) might be downplayed or omitted entirely in favor of more analysis of business data.
St Louis University lists the following topics as being included in their Business Statistics course. The list is fairly typical of the topics usually covered. I’ve bolded the items unique to business statistics.
- Introduction to descriptive statistics for displaying and summarizing business data.
- The use of probabilities and random variables in business decision models.
- Probability distribution.
- Statistical inference as a decision-making tool.
- Sampling of business data.
- Simple linear regression and correlation.
- Time series analysis.
- Use of index numbers in economic data.
1. Describing Populations and Samples.
The process of describing populations and samples is called Descriptive Statistics. A population includes everyone in the area of interest. For example, every person in the United States, every dog owner in Florida, or every computer user in the world. A sample is a small piece of the whole (i.e. 1000 people in the United States, 250 Floridian dog owners, 2500 worldwide computer users). There are three main ways to describe populations and samples: central tendency, dispersion and association.
Measures of Central Tendency.
In this area, you find where the bulk of the data lies. It includes finding the mean, mode and median. The formulas for finding the population mean and sample mean have slightly different symbols:
Sample mean formula:
x̄ = ( Σ xi ) / n.
Population mean: μ = (Σ * X)/ N.
They are solved in the same way: add the items together and then divide by the number of items in the set.
Measures of Dispersion.
How much is your data set spread out around the mean? Is there a big difference between your highest and lowest values? These are questions that can be answered by finding the interquartile range, variance and standard deviation. The interquartile range is especially useful if you are more interested in where the bulk of your data lies and less interested in extreme values. For example, a business geared towards 20-somethings might want to plot the age range for customers who walk in the door. This makes sure they are marketing to the right age group; ideally, most customers should be in their 20s.
Measures of Association
Measures of association tell you about trends in data. For example, you could make a plot showing current manufacturing costs. This might show a high or low connection (“correlation”) between different factors and final cost. The factors could include employee time off, the price of oil, or location of the plant. Covariance is how two variables change together. If the price of tomatoes goes up, it directly affects the price of ketchup. The price of corn (to make high fructose corn syrup) also affects the price of ketchup, but in a smaller way.
2. Probabilities and Random Variables.
Probability is the foundation of business statistics. Several formulas are used, including the basic formula:
P(A) = number of outcomes that give A / number of possible outcomes = r / n.
A simple example:
Q. A box of factory rejects contains 5 balls that are too small, 3 balls that are too big and 2 under-inflated balls. If a ball is chosen at random from the box, what is the probability that it is:
(a) too small; (b) too small or under-inflated; (c) not under-inflated?
Answers:
(a) P(A) = r/n = 5/10 = 0.5;
(b) p(A) = r/n = 5+2/10 = 0.7;
(c) P(A) = r/n = 8/10 = 0.8.
There are dozens of ways to figure out probabilities. It largely depends on what you want to know. For example, something happening or not happening, choosing people or items.
In algebra, and “x” or “y” can represent a number, like 3,14,or 22.5. In statistics, a random variable must be linked to a random event or experiment. Let’s say you wanted to know how many faulty televisions are produced on a certain line. Your random variable, X could be the number of faulty televisions produced in 24 hours. A business decision model takes data and applies logic to arrive at a business decision. In the case of the faulty televisions, data could be measured each time a change is made to the production line. This data could be used to see what changes lead to improve quality, and which do not.
List of step by step probability articles: Probability Index.
3. Probability Distributions.
Probability distributions can be discrete or continuous.
Discrete Distributions.
Examples of discrete distributions include the Binomial Distribution.
In a binomial experiment, there are only two outcomes (like yes/no or success/failure). The formula is:
![]()
Q. An employment test has 10 multiple choice questions with five choices for each question.
A. If someone guesses randomly (i.e. without reading the questions), what is the probability they get exactly 6 questions right?
Plugging the values into the formula, you get:
P(X) = 10! / (10 – 6)! 6! * (.2)6 * (.8)10-6 = 0.005505024
The “p” here is 0.2 because you have a 1 out of 5, or 20% chance of getting a question right if you guess. “q” is just 1-p (100% – 20% = 80%). You might actually see “1-P” in some versions of this formula.
Step by step article: How to Work a Binomial Distribution Formula.
Similar Distributions to the binomial:
- The Negative Binomial distribution is similar to the binomial, but it does not have a fixed number of trials.
- The Geometric Distribution represents the number of failures before you get a success in a series of Bernoulli trials.
- Poisson Distribution: used to predict the probability of certain events from happening when you know how often the event has occurred. For example, if a store that rents books has an average rental of 200 books every Saturday night. Using this data, you can predict how many more books will sell on the following Saturday nights.
Continuous probability distributions can take on an infinite number of different values. Examples include:
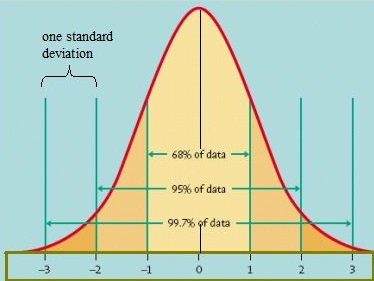
- Normal distribution. Commonly known as the “bell curve”, it’s used to model lots of situations, like exam scores, IQ, and heights.
- Student’s T distribution: similar to the normal, but used for small samples (under 30 items).
- Chi-square distribution: has many used in stats, like comparing categorical variables.
- F Distribution. Used for a specific type of test called Analysis of Variance.
Of all these, the normal distribution (the “bell curve”) is probably the most recognizable and is widely used in business. Businesses use the model for lots of reasons, including compensation and performance reviews. While the curve is relatively easy to understand and use, caution should be used when applying it to people: new research is showing that the distribution isn’t actually a good predictor of people’s performance. “As a result,” states Forbes, “HR departments and business leaders inadvertently create agonizing problems with employee performance and happiness.”
4. Inferential Statistics.
While descriptive statistics “describes” data, inferential statistics make inferences. In other words, you take data and make some sort of conclusion. The two main areas are parameter estimation and hypothesis testing.
Parameter Estimation.
With parameter estimation, you take a sample of data (say, 100 out of 1,000) and find a statistic. Let’s say you find the average salary of 100 workers is $20 per hour. You take that statistic ($20 per hour) and infer that the population of 1,000 probably has a salary of about $20. It might not be exactly $20, but it’s probably going to be close, around $19 to $21. The range is called a confidence interval. This interval is part of the results you get from a hypothesis test.
The Hypothesis Test.
If you’re in business, you might come up with some good ideas about how to improve sales or other metrics. For example, you might think that your average customer is older than average, or that placing certain products at the front of the store can raise the bottom line. These guesses are just shots in the dark without some hard data to back them up. A hypothesis test gives you a solid way to back your guess (called a hypothesis) with some hard data (via a statistical test).
Of course, it isn’t quite as simple as just running a test. You’ll have a lot of decisions to make before you run the test, like what level of accuracy you want (called a significance level). You’ll also need to carefully gather the data to go into the test: if poor quality data goes in, you’ll get poor quality results out. Hypothesis testing is one of the most complex procedures you’ll come across in business statistics. Therefore, it’s typically one of the most challenging areas for students.
Step by step procedures for hypothesis testing can be found in Hypothesis Testing Examples.
5. Sampling of business data.
When you want to get a sample in business statistics, you can’t just pick a few random items from the stack. You have to be careful to make sure your sample is representative of the entire population. This isn’t as simple as it seems; sampling can be a complicated process. There are literally dozens of methods to choose from. These include picking numbers from a hat (called simple random sampling) and using your contacts to make other contacts (called snowball sampling). For a full list of methods, see: Sampling in Statistics.
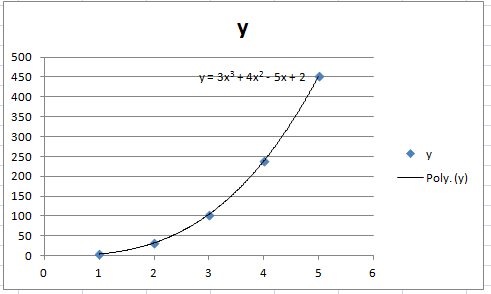
6. Simple linear regression and correlation.
Simple linear regression and correlation are used in business statistics to predict trends. For example, you might have a list of sales data from a group of stores. You can use that data to make predictions about where the sales are headed; regression can create a model for the future sales. Correlation takes a set of variables and tells you how well they are related. You can answer question like “…are increased sales due to the improving economy, a recent mail order campaign, or improved staff training?”
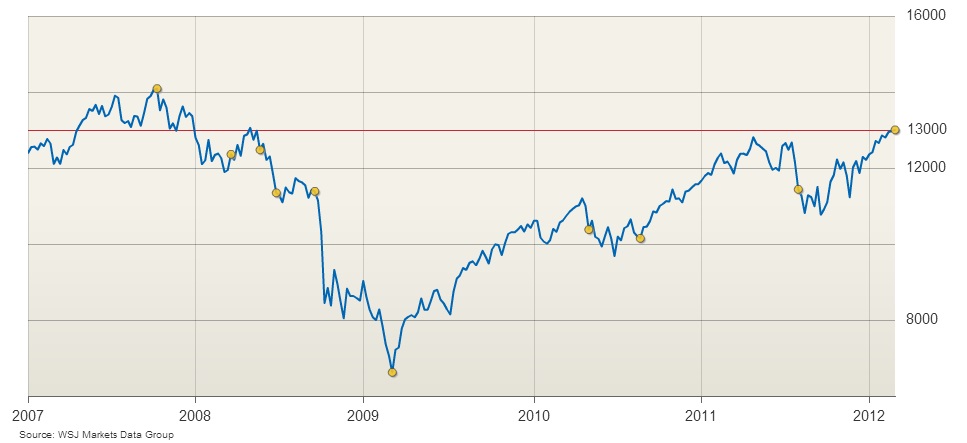
7. Time series analysis.
A time series graph (also called a timeplot), plots values against time. They are exactly the same as a basic Cartesian planex-y graph with one restriction: the x-axis can only display time.
8. Use of index numbers in economic data.
Index numbers tell you how something performs over time. The index always starts at a given year at 100%. Over time, the percentage increases over 100%. For example, an index of 190% shows an increase of 90% from the base year. A decrease shows a decrease compared to the index year. Let’s say the mean wage in 1980 was $20,000 and the index for 1990 shows 110%. This means wages increased by 10%, or $2,000. A decrease to 90% in 1990 would mean that wages dropped, on average, by $2,000.
Indexes make it easier to compare something from an earlier year to a later year. House prices, wages, and stock prices are commonly reported in index years.
Related Articles
Reference:
St. Louis University. Retrieved July 2015 from: http://mathcs.slu.edu/undergrad-math/introductory-statistics.