Contents:
There are many different definitions for index/indices or index number. Which definition the term has depends on where you’re using it. For example, the index in a radical function has a completely different meaning from the index in a summation. Why are there all these different definitions? An “index” is much like a “variable”. The word “variable” doesn’t have any real meaning until you put it in context (for example, an independent variable is wholly different from an intermediate variable.
Index Number (General Math)
An index number in a radical function refers to the little number to the left of the radical sign, which tells you what root you’re working with. For example, the index in ∛x refers to a cubed root. Similarly, the index could also refer to the power of an exponent raised to a number or a variable. For example, in the exponential function f(x) = 2x, x is the index of 2.
In classical math, “index” means something different: a discrete logarithm. A special branch of calculus called index calculus deals with these indices.
Index (Calculus)
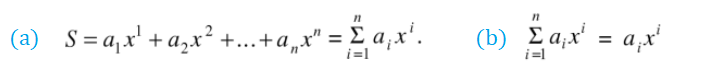
In calculus, the term “index number” or “index” is usually used as a placeholder for the beginning of a summation. For example:
In summation notation i is the index of summation. It doesn’t have to be “i”: it could be any variable (e.g. j, k, x).

In Einstein summation, you can have two indices: one raised and one lowered.
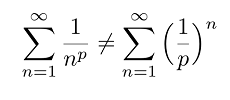
You might come across an index in p-series or geometric series:
Index Number (Economics)
An index number is the measure of change in a variable (or group of variables) over time. It is typically used in economics to measure trends in a wide variety of areas including: stock market prices, cost of living, industrial or agricultural production, and imports. Index numbers are one of the most used statistical tools in economics.
Index numbers are not directly measurable, but represent general, relative changes. They are typically expressed as percentages.
Examples of Index Numbers
The consumer price index is the best known index number in the United States; based on price changes for a group of selected products, it is considered to give an “average” value of inflation. Other index numbers you’ve likely heard referenced many times are the Dow Jones Industrial Average for the New York Stock Exchange and the Nasdaq composite for the American Stock Exchange. The Dow Jones index measures the change in stock prices over a set of about 30 large companies which are considered to be representative of business in the United States. The Nasdaq index measures change over all of the roughly 3,000 stocks listed in the Nasdaq market.
Calculating an Index Number
Although the idea behind them all is the same, there is no one single way to calculate index numbers.
The Dow Jones Industrial Average is taken simply by adding the price of all 30 stocks and dividing by the Dow Divisor, a number that stays fairly constant but is adjusted when there are stock splits, spinoffs or other structural changes. In September of 2017, the Dow Divisor was 0.14523396877348.
DJIA = (Σ p)/d
Where:
- Σ is a summation,
- d is the Dow Divisor,
- p is the prices of each of the stocks included in the index.
The Consumer Price Index (CPI) is calculated with a more complicated, two step procedure. First, elementary indices are created from data representing the price of similar goods in identical areas. In June of 2007, there were 211 categories and 38 geographical areas with 8,018 of these elementary indices. Almost all of the elementary indices are calculated using formulas based on the idea of a geometric mean.
After all 8,018 basic indices are computed, an aggregate index is composed from all of that data. Laspeyres method is used to compute this, with the formula:
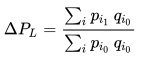
Where:
- ΔL is the relative change in price level.
- pi0 is the price of each item i in the first period.
- qi0 is the quantity of each item i in the first period.
- pi1 is the price of each item i in the second period.
References
Agresti A. (1990) Categorical Data Analysis. John Wiley and Sons, New York.
Gonick, L. (1993). The Cartoon Guide to Statistics. HarperPerennial.
Kotz, S.; et al., eds. (2006), Encyclopedia of Statistical Sciences, Wiley.
Vogt, W.P. (2005). Dictionary of Statistics & Methodology: A Nontechnical Guide for the Social Sciences. SAGE.