Types of Variable > Independent Variable
Contents:
1. Independent Variable Definition.
Independent variables are variables that stand on their own and aren’t affected by anything that you, as a researcher, do. You have complete control over which independent variables you choose. During an experiment, you usually choose independent variables that you think will affect dependent variables. Those are variables that can be changed by outside factors. If a variable is classified as a control variable, it may be thought to alter either the independent variable or dependent variable but it isn’t the focus of the experiment.
Example: you want to know how calorie intake affects weight. Calorie intake is your independent variable and weight is your dependent variable. You can choose the calories given to participants, and you see how that independent variable affects the weights. You may decide to include a control variable of age in your study to see if it affects the outcome.
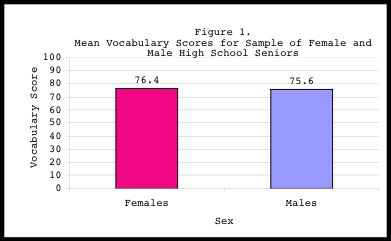
The above graph shows the independent variable of male or female plotted on the x-axis. “Male” or “Female” is unchangeable by you, the researcher, or anything you can perform in your experiment. On the other hand, the dependent variable of “mean vocabulary scores” is potentially changed by which independent variable is assigned. In other words, the mean vocabulary scores depend on the independent variable: whether the participant is male or female.
Another way of looking at independent variables is that they cause something (or are thought to cause something). In the above example, the independent variable is calorie consumption. That’s thought to cause weight gain (or loss).
Independent Variables: Other Names and Uses.
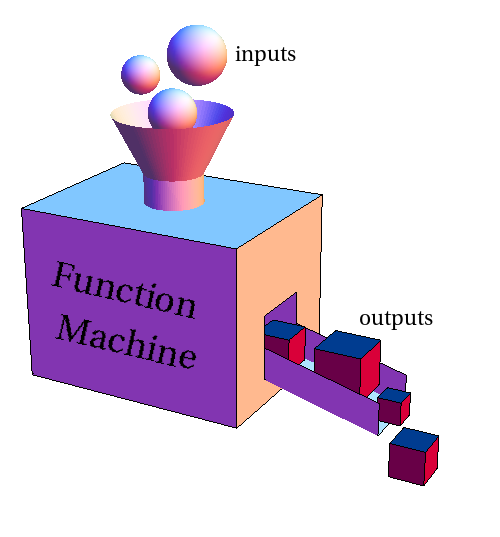
Independent variables are also called the “inputs” for functions. They are traditionally plotted on the x-axis of a graph. Dependent variables are usually plotted on the y-axis. Sometimes it’s possible to switch the two variables around (i.e. switch independent to dependent), but it can be challenging to see if it makes sense. A helpful tool is the vertical line test, which will tell you whether or not the switch resulted in a function (functions are necessary for the bulk of statistical analysis).
In statistics, an independent variable is also sometimes called:
- A controlled variable.
- An explanatory variable.
- An exposure variable (in reliability theory).
- A feature (in machine learning and pattern recognition).
- An input variable.
- A manipulated variable.
- A predictor variable.
- A regressor (in regression analysis).
- A risk factor (in medical statistics).
What is a Predictor Variable?
A predictor variable has essentially the same meaning as an independent variable. It’s plotted on the x-axis, and it affects a dependent variable. However, it’s not exactly the same, as you use the term in very specific situations:
- In regression analysis, where the predictor variable is also called a regressor. The other variable (comparable to the dependent variable) is called a criterion variable.
- In non-experimental studies, where it is the presumed “cause.” For example, scores on a math test indicate an aptitude for engineering. “Scores on the math test” are the predictor variables and engineering aptitude is the criterion variable.
Types of Predictor Variable.
The two main types are:
- Quantitative Predictors, which have a numerical value (i.e. 5.5,800,2K) for categories like age, height, test scores or weight.
- Qualitative Predictors, which do not have numerical values. Used for categories like gender, socioeconomic status, political affiliation or geographic location.
A common workaround to working with qualitative predictors is to assign them to a numerical class when performing correlational studies. For example, if you were performing a study that was looking at the effect of sex and income, you might assign the following classes:
- Woman(1).
- Man(2).
- Transgender woman(3).
- Transgender man(4).
When you only have two classes coded 0 or 1, it’s called a dummy variable. Dummy variables can make it easier to understand the results from a regression analysis. Other codings, like 2/3 or 8/9 can also be used (they just make the output more difficult to comprehend).
Multiple Predictor Variables
Some regression models can include dozens of predictor variables. That’s a model that Professor David Dranove of the Kellogg school of management calls the “kitchen sink” regression method. It’s possible for thousands of potential predictor variables to make up a data set, so care should be taken in choosing which ones you use for your analysis. There are several reasons for this, one of which is the more variables you throw in to the mix, the weaker your model.
Some rules of thumb for choosing variables:
- Select a maximum of one predictor variable for every five observations, if your predictive model is good.
- Use a maximum of one predictor variable for every ten observations if your predictive model is weak, or if you have a slew of variables to choose from.
- If you have categorical variables, treat each included one as half of a normal predictor.
Levels of Independent Variable
While you might study one IV for a science fair project, it more common to have many levels of the same IV. You can think of a “level” as a sub type of the IV. For example, you might be studying weight loss for three different diets: Atkins, Paleo, and Vegan. The three diets are the three levels of Independent Variable. Or, you could have an experiment where you are comparing two treatments: placebo and experimental. In that case, you have two levels.
Reference:
Dranove, P. Retrieved 12-2015 from: https://www.kellogg.northwestern.edu/faculty/dranove/htm/Dranove/coursepages/Mgmt%20469/choosing%20variables.pdf
UNM.EDU. Retrieved 12-2015 from: http://math-cobalt.oit.umn.edu/function_machine