Previous article: Excel 2013 Regression Analysis How To
Excel Regression Analysis Output Explained
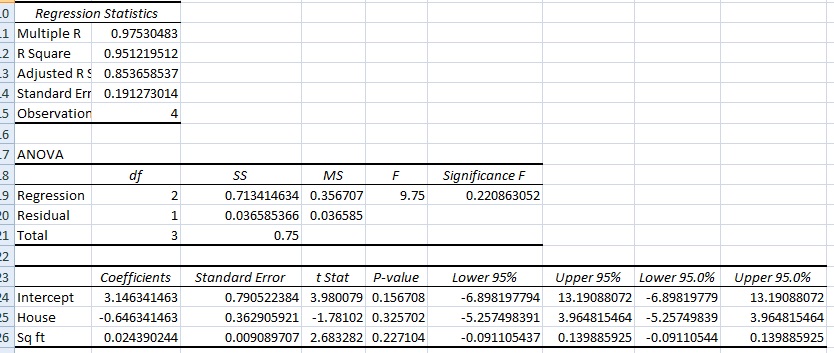
In the previous article, I explained how to perform Excel regression analysis. After you’ve gone through the steps, Excel will spit out your results, which will look something like this:
Excel Regression Analysis Output Explained: Multiple Regression
Here’s a breakdown of what each piece of information in the output means:
EXCEL REGRESSION ANALYSIS OUTPUT PART ONE: REGRESSION STATISTICS
These are the “Goodness of Fit” measures. They tell you how well the calculated linear regression equation fits your data.
- Multiple R. This is the correlation coefficient. It tells you how strong the linear relationship is. For example, a value of 1 means a perfect positive relationship and a value of zero means no relationship at all. It is the square root of r squared (see #2).
- R squared. This is r2, the Coefficient of Determination. It tells you how many points fall on the regression line. for example, 80% means that 80% of the variation of y-values around the mean are explained by the x-values. In other words, 80% of the values fit the model.
- Adjusted R square. The adjusted R-square adjusts for the number of terms in a model. You’ll want to use this instead of #2 if you have more than one x variable.
- Standard Error of the regression: An estimate of the standard deviation of the error μ. This is not the same as the standard error in descriptive statistics! The standard error of the regression is the precision that the regression coefficient is measured; if the coefficient is large compared to the standard error, then the coefficient is probably different from 0.
- Observations. Number of observations in the sample.
EXCEL REGRESSION ANALYSIS OUTPUT EXPLAINED PART TWO: ANOVA
- SS = Sum of Squares.
- Regression MS = Regression SS / Regression degrees of freedom.
- Residual MS = mean squared error (Residual SS / Residual degrees of freedom).
- F: Overall F test for the null hypothesis.
- Significance F: The significance associated P-Value.
The second part of output you get in Excel is rarely used, compared to the regression output above. It splits the sum of squares into individual components (see: Residual sum of squares), so it can be harder to use the statistics in any meaningful way. If you’re just doing basic linear regression (and have no desire to delve into individual components) then you can skip this section of the output.
For example, to calculate R2 from this table, you would use the following formula:
R2 = 1 – residual sum of squares (SS Residual) / Total sum of squares (SS Total).
In the above table, residual sum of squares = 0.0366 and the total sum of squares is 0.75, so:
R2 = 1 – 0.0366/0.75=0.9817
EXCEL REGRESSION ANALYSIS PART THREE: INTERPRET REGRESSION COEFFICIENTS
This section of the table gives you very specific information about the components you chose to put into your data analysis. Therefore the first column (in this case, House / Square Feet) will say something different, according to what data you put into the worksheet. For example, it might say “height”, “income” or whatever variables you chose.
The columns are:
- Coefficient: Gives you the least squares estimate.
- Standard Error: the least squares estimate of the standard error.
- T Statistic: The T Statistic for the null hypothesis vs. the alternate hypothesis.
- P Value: Gives you the p-value for the hypothesis test.
- Lower 95%: The lower boundary for the confidence interval.
- Upper 95%: The upper boundary for the confidence interval.
The most useful part of this section is that it gives you the linear regression equation:
y = mx + b.
y = slope * x + intercept.
For the above table, the equation would be approximately:
y = 3.14 – 0.65X1 + 0.024X2.
Take Care with Interpreting Certain Terms
Use caution when interpreting regression models that contain certain terms; It’s impossible to look at just the linear term (a main effect) and draw a conclusion. For example:
- A significant polynomial term can make the results difficult to analyze because changing a predictor variable varies, depending on the value of the predictor.
- A significant interaction term indicates the variation is due to the value of a different predictor.
References
Cameron. Excel Multiple Regression. http://cameron.econ.ucdavis.edu/excel/ex61multipleregression.html
Minitab. How to Interpret Regression Analysis Results: P-values and Coefficients.
Salkind, N. (2015). Excel Statistics: A Quick Guide Third Edition. SAGE Publications.