Hypothesis Testing > F-Test Contents:
See also: F Statistic in ANOVA/Regression
Watch the video for an overview of the F Test:

What is an F Test?
An “F Test” refers to any test that uses the F-distribution and f-statistic. Typically, when people mention the F-Test, they are referring to the F-Test to Compare Two Variances. However, the f-statistic is also used in various tests such as regression analysis, the Chow test, and the Scheffe Test (a post-hoc ANOVA test).
The F-test can be used to test the following hypotheses:
- The variances of two populations are equal.
- The variances of two samples are equal.
- The variance of a population equals a certain value.
- The variance of a sample equals a certain value.
The F-test is frequently applied in the analysis of variance (ANOVA) to establish whether the variability among the groups is greater than the variability within groups. If the variability between the groups exceeds the variability within them, it is probable that the group means differ also.
Additionally, the F-test can be used to assess the significance of a multiple regression model. In this context, the F-test aims to ascertain if the overall model is significant, implying that the model’s independent variables can account for the variance in the dependent variable.
Some examples of when an F-test might be used:
- To compare the variances of the heights of two different groups of people.
- To compare variances of the scores on a final for two different groups of college students.
- To test the significance of a multiple regression model used to predict commercial property prices.
General Steps for an F Test
If you’re running an F Test, you should use Excel, SPSS, Minitab or some other kind of technology to run the test.
Why? Calculating the F test by hand, including variances, is tedious and time-consuming. Therefore you’ll probably make some errors along the way. If you’re running an F Test using technology (for example, an F Test two sample for variances in Excel), the only steps you really need to do are Step 1 and 4 (dealing with the null hypothesis). Technology will calculate Steps 2 and 3 for you.
- State the null hypothesis and the alternate hypothesis.
- For Comparing Two Variances:
- Null Hypothesis (H₀): The variances are equal (σ₁² = σ₂²).
- Alternative Hypothesis (H₁): The variances are not equal (σ₁² ≠ σ₂²).
- For Comparing Regression Models:
- Null Hypothesis (H₀): The restricted model (with certain parameters equal to zero or specific values) fits the data as well as the unrestricted model.
- Alternative Hypothesis (H₁): The unrestricted model provides a better fit than the restricted model.
- For Comparing Two Variances:
- Calculate the F value. The F Value is calculated using the formulas in the next section.
- Find the Critical Value or P-value:
- Critical Value: Find the F-critical value from the F-distribution table using the correct degrees of freedom for your test:
- Numerator degrees of freedom (df₁): m (number of restrictions).
- Denominator degrees of freedom (df₂): n – k.
- Choose a significance level (α), for example 0.05.
- Critical Value: Find the F-critical value from the F-distribution table using the correct degrees of freedom for your test:
- P-value Approach: Use software to calculate the p-value associated with the calculated F-statistic.
- Support or Reject the Null Hypothesis.
- If F-statistic > F-critical value or p-value < α: Reject the Null Hypothesis (H₀).
- If F-statistic ≤ F-critical value or p-value ≥ α: Do Not Reject the Null Hypothesis (H₀).
The F-test formula
The f-test formula for comparing two variances, s1 and s2 is:
F = s21 / s22
The F-value is always positive since variances are always positive.
If you’re comparing two regression models, the formula gets a bit more complicated [1]: 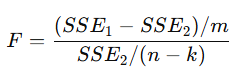 where
where
- SSE1 = the sum of squared errors in the restricted regression model
- SSE2 = the sum of squared errors in the unrestricted regression model (the full model)
- n = sample size
- m = number of restrictions. Counting restrictions is the same thing as counting the number of equals signs in your regression equation. For example:
- H0: Β1 = Β2 = 0 has two restrictions
- H0: Β1 = 1, Β2 = 3, Β3 = 4 has three restrictions [2].
- k = total parameters estimated in the unrestricted model (including the intercept).
When conducting an F Test, it’s recommended to use Excel, SPSS, Minitab, or other software to perform the test. This is because the formula is deceptively simple: calculating the F test by hand, including variances, can be laborious and prone to errors.
F Test to Compare Two Variances
A Statistical F Test uses an F Statistic to compare two variances, s1 and s2, by dividing them. The result is always a positive number (because variances are always positive).
The equation for comparing two variances with the f-test is: F = s21 / s22
If the variances are equal, the ratio of the variances will equal 1. For example, if you had two data sets with a sample 1 (variance of 10) and a sample 2 (variance of 10), the ratio would be 10/10 = 1.
You always test that the population variances are equal when running an F Test. In other words, you always assume that the variances are equal to 1. Therefore, your null hypothesis will always be that the variances are equal.
Assumptions
Several assumptions are made for the test. Your population must be approximately normally distributed (i.e. fit the shape of a bell curve) in order to use the test. Plus, the samples must be independent events. In addition, you’ll want to bear in mind a few important points:
- The larger variance should always go in the numerator (the top number) to force the test into a right-tailed test. Right-tailed tests are easier to calculate.
- For two-tailed tests, divide alpha by 2 before finding the right critical value.
- If you are given standard deviations, they must be squared to get the variances.
- If your degrees of freedom aren’t listed in the F Table, use the larger critical value. This helps to avoid the possibility of Type I errors.
F Test to compare two variances by hand: Steps
Warning: F tests can get really tedious to calculate by hand, especially if you have to calculate the variances. You’re much better off using technology (like Excel — see below). These are the general steps to follow. Scroll down for a specific example.- If you are given standard deviations, go to Step 2. If you are given variances to compare, go to Step 3.
- Square both standard deviations to get the variances. For example, if σ1 = 9.6 and σ2 = 10.9, then the variances (s1 and s2) would be 9.62 = 92.16 and 10.92 = 118.81.
- Take the largest variance, and divide it by the smallest variance to get the f-value. For example, if your two variances were s1 = 2.5 and s2 = 9.4, divide 9.4 / 2.5 = 3.76. Why? Placing the largest variance on top will force the F-test into a right tailed test, which is much easier to calculate than a left-tailed test.
- Find your degrees of freedom. Degrees of freedom is your sample size minus 1. As you have two samples (variance 1 and variance 2), you’ll have two degrees of freedom: one for the numerator and one for the denominator.
- Look at the f-value you calculated in Step 3 in the f-table. Note that there are several tables, so you’ll need to locate the right table for your alpha level.
- Compare your calculated value (Step 3) with the table f-value in Step 5. If the f-table value is smaller than the calculated value, you can reject the null hypothesis.
That’s it!
Two Tailed F-Test
The difference between running a one or two tailed F test is that the alpha level needs to be halved for two tailed F tests.
For example, instead of working at α = 0.05, you use α = 0.025; Instead of working at α = 0.01, you use α = 0.005. With a two tailed F test, you just want to know if the variances are not equal to each other. In notation: Ha = σ21 ≠ σ2 2
Example problem: Conduct a two tailed F Test on the following samples: Sample 1: Variance = 109.63, sample size = 41. Sample 2: Variance = 65.99, sample size = 21.
- Write your hypothesis statements: Ho: No difference in variances. Ha: Difference in variances.
- Calculate your F critical value. Put the highest variance as the numerator and the lowest variance as the denominator: F Statistic = variance 1/ variance 2 = 109.63 / 65.99 = 1.66
- Calculate the degrees of freedom: The degrees of freedom in the table will be the sample size -1, so: Sample 1 has 40 df (the numerator). Sample 2 has 20 df (the denominator).
- Choose an alpha level. No alpha was stated in the question, so use 0.05 (the standard “go to” in statistics). This needs to be halved for the two-tailed test, so use 0.025.
- Find the critical F Value using the F Table. There are several tables, so make sure you look in the alpha = .025 table. Critical F (40,20) at alpha (0.025) = 2.287.
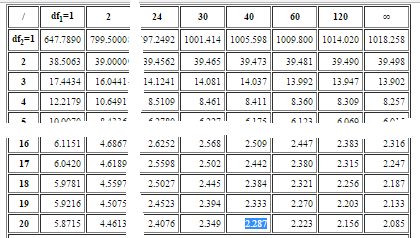
- Compare your calculated value (Step 2) to your table value (Step 5). If your calculated value is higher than the table value, you can reject the null hypothesis: F calculated value: 1.66 F value from table: 2.287. 1.66 < 2 .287. So we cannot reject the null hypothesis.
F-Test to Compare Two Variances in Excel
F-test two sample for variances Excel 2013: Steps
- Click the “Data” tab and then click “Data Analysis.”
- Click “F test two sample for variances” and then click “OK.”
- Click the Variable 1 Range box and then type the location for your first set of data. For example, if you typed your data into cells A1 to A10, type “A1:A10” into that box.
- Click the Variable 2 box and then type the location for your second set of data. For example, if you typed your data into cells B1 to B10, type “B1:B10” into that box.
- Click the “Labels” box if your data has column headers.
- Choose an alpha level. In most cases, an alpha level of 0.05 is usually fine.
- Select a location for your output. For example, click the “New Worksheet” radio button.
- Click “OK.”
- Read the results. If your f-value is higher than your F critical value, reject the null hypothesis as your two populations have unequal variances.
Warning: Excel has a small “quirk.” Make sure that variance 1 is higher than variance 2. If it isn’t switch your input data around (i.e. make input 1 “B” and input 2 “A”). Otherwise, Excel will calculate an incorrect f-value. This is because the variance is a ratio of variance 1/variance 2, and Excel can’t work out which set of data is set 1 and set 2 without you explicitly telling it. 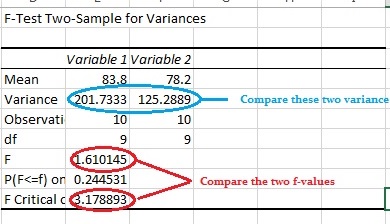 Back to Top
Subscribe to our Youtube channel for more statistics videos.
References
- O’Halloran, S. Lecture 13: Explaining Variation
- 7 – Joint Hypothesis Tests