Statistics Definitions > Residual Sum of Squares, Total and Explained
Contents:
- Sum of Squares.
- Total Sum of Sq.
- Explained Sum of Sq.
- Residual Sum of Sq.
- Sum of Squares Within
- Error Mean Sum of Squares.
- Extra Sum of Squares
- Uses.
Watch the video for an overview of the normal distribution, or read on below.

Can’t see the video? Click here to watch it on YouTube.
1. What is sum of squares?
Sum of squares is a measure of dispersion, like variance and standard deviation. The standard deviation is the main measure of dispersion in statistics [1], and if you’ve calculated it by hand you’ve already calculated a sum of squares, which is part of the standard deviation formula. Sum of squares is a measure of how a data set varies around a central number (such as the mean). You might realize by the phrase that you’re summing (adding up) squares—but squares of what? You’ll sometimes see this formula: 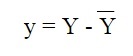 Other times you might see actual “squares”, like in this regression line:
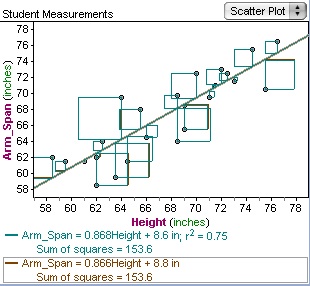
Squares of numbers, as in 42 and 102 can be represented with actual geometric squares (image courtesy of UMBC.edu):  So the square shapes you see on regression lines are just representations of square numbers, like 52 or 92. When you’re looking for a sum of squares, use the formula to find the actual number that represents a sum of squares. A diagram (like the regression line above) is optional, and can supply a visual representation of what you’re calculating.
The total sum of squares (TSS), the explained sum of squares (ESS), the residual sum of squares (ESS), and sum of squares within (SSW) are all measures of variation in a data set. However, they measure different types of variation.
Formula and Example
The formula for the sum of the squares of deviations from the means is [2]:
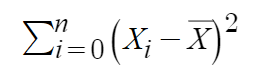
where:
- Xi= ith item in the set
- X̄ = mean of the set
- (Xi−X̄) = deviation of each item from the mean.
Q. Find the Sum of Squares for the following numbers: 3, 5, 7.
-
- Find the mean by adding the numbers together and dividing by the number of items in the set:
- (3 + 5 + 7) / 3 = 15 / 3 = 5
- Subtract the mean from each of your data items:
- 3 – 5 = -2
- 5 – 5 = 0
- 7 – 5 = 2
- Square your results from Step 3:
- -2 x -2 = 4
- 0 x 0 = 0
- 2 x 2 = 4
- Sum (add up) all of your numbers:
- 4 + 4 + 0 = 8.
- Find the mean by adding the numbers together and dividing by the number of items in the set:
That’s it!
The higher the sum of squares, the more variation in the data. This can be useful in comparing different data sets.
An alternate formula is ΣX2 – ((ΣX)2 / N), which gives the same results. For example:
- ΣX = 3 + 5 + 7 = 15
- (ΣX)2 = 15 * 15 = 225
- ΣX2 = 9 + 25 + 49 = 83
- N = 3
So we have ΣX2 – ((ΣX)2 / N) = 83 – (225/3) = 8.
2. What is the Total Sum of Squares?
The Total SS (TSS or SST) tells you how much variation there is in the dependent variable. The formula is:
Total SS = Σ(Yi – mean of Y)2.
which can also be written as
TSS = Σ(Yi – Ȳ)2,
where
- Σ = summation
- Yi = the actual value of the dependent variable for observation i
- Ȳ = the predicted value of the dependent variable for observation i
- Σ = the sum of all values.
The higher the TSS, the more variation in the dependent variable. The TSS is a useful measure for comparing models: the model with the lower TSS is the better model, because it is able to explain more of the variation in the dependent variable. The TSS is also a useful measure for determining a model’s significance. If the TSS is small, then the model is significant, and it is likely that the model is not due to chance.
3. What is the Explained Sum of Squares?
The Explained SS tells you how much of the variation in the dependent variable your model explained.
The formula is
ESS = Σ(Ȳ – mean of Y)2,
where:
- Ȳ is the predicted value of Y
- Y is the observed value of Y
- Σ is the sum of all values.
The ESS is a non-negative value, and it can range from zero to the total variation in the dependent variable. The higher the ESS, the better the model is able to explain the variation in the dependent variable. Therefore, the ESS is a useful measure for comparing models. However, the ESS is not the only measure to consider when comparing models. Other measures, such as the residual sum of squares (RSS) and the adjusted R-squared can also be helpful.
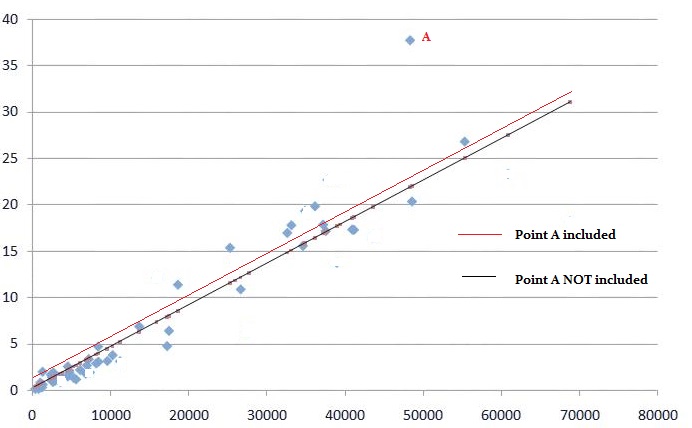
4. What is the Residual Sum of Squares?
The residual sum of squares (RSS) helps determine the suitability of a model for your data by measuring the overall difference between your observed data and the values predicted by the estimation model. More specifically, the RSS provides insight into the amount of unexplained variation in the dependent variable. It is calculated as the sum of the squared differences between the actual Y values and the predicted Y values:
RSS = Σ e2
where
- e = the difference between the actual and predicted Y value
- Σ = the sum of all values.
Manual computation of the formula is time-consuming and prone to errors,. It is much more efficient to rely on software such as R, SAS or Excel, which performs these calculations seamlessly without requiring deep knowledge of the underlying formulas.
A lower RSS indicates a better fit of the model to the data, while a higher value suggests a poor fit. A perfect fit is represented by a residual sum of squares of zero.
One important application is determining the coefficient of determination (R2), which indicates the ratio of the explained sum of squares to the total sum of squares.
5. Sum of Squares Within
Within-group variation is reported in ANOVA output as SS(W) or which means Sum of Squares Within groups or SSW: Sum of Squares Within. It is intrinsically linked to between group variation (Sum of Squares between), variance difference caused by how groups interact with each other.
SSW is one component of total sum of squares (the other is between sum of squares). Within sum of squares represents the variation due to individual differences in the score. In other words, it’s the variation of individual scores around the group mean; it is variation not due to the treatment.
6. Error Mean Sum of Squares
The Error Mean Sum of Squares, (MSE), is a measure of the variation within the groups in a one-way ANOVA. It is calculated by dividing the sum of squares within the groups by the error degrees of freedom (the number of observations minus the number of groups.) [3]:
MSE = SS(Error)/(n−m).
A higher MSE suggests that there is higher variation within the groups, which means that the groups are more heterogeneous. A lowe MSE suggests the groups are more homogeneous.
7. Extra SS
Extra Sums of Squares (ESS) represents the difference in the Error Sums of Squares (SSE) between two models. Specifically, ESS measures the incremental reduction in SSE when including an additional set of predictors in the model.
ESS serves as a tool for comparing models, providing a single numerical value. If ESS equals zero, it indicates that the models are identical.
The formula for calculating Extra Sums of Squares is:
ESS = Residual sum of squares (reduced) – Residual Sum of Squares (full).
Suppose you have a model with one predictor variable, X1. By introducing a second predictor, X2, to the model, ESS quantifies the additional variation explained by X2. This relationship can be expressed as:
SSR (X2 | X1).
In terms of SSE, imagine you have a model with X1 as the predictor variable. When you introduce a new variable, X2, to the model, Extra Sums of Squares explains the portion of SSE not accounted for by X1. This can be written as:
SSR (X2 | X1) = X1 – (X1, X2)
8. Uses
You’ll find sums of squares in ANOVA as a measure of variation and in regression analysis, where it is a measure the goodness of fit of a regression model. For example, residual sum of squares helps you to decide if a statistical model is a good fit for your data; a “residual” is a measure of the distance from a data point to a regression line. As you can probably guess, things get a little complicated when you’re calculating sum of squares in regression analysis or hypothesis testing. It is rarely calculated by hand; instead, software like Excel or SPSS is usually used to calculate the result for you.
For reference, sum of squares in regression uses the equation:
![]()
- Y = the actual value of the dependent variable
- Ŷ = the predicted value of the dependent variable
- Σ = the sum of all values
And in ANOVA it is calculated with the formula:
The total SS = treatment sum of squares (SST) + SS of the residual error (SSE)
In ANOVA, Total SS is related to the total sum and explained sum with the following formula:
Total SS = Explained SS + Residual Sum of Squares.
The sum of squares can also be used to calculate other statistical measures, such as the coefficient of determination and the mean squared error.