Contents:
- What is a Least Squares Regression Line?
- How to find a Least Squares Regression Line Equation by Hand.
- How to find the equation using technology.
- What is Least Squares Fitting?
- Ordinary Least Squares.
- Partial Least Squares.
1. What is a Least Squares Regression Line?
If your data shows a linear relationship between the X and Y variables, you will want to find the line that best
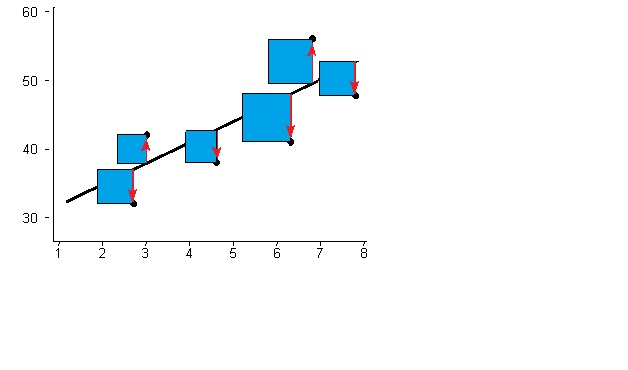
fits that relationship. That line is called a Regression Line and has the equation ŷ= a + b x. The Least Squares Regression Line is the line that makes the vertical distance from the data points to the regression line as small as possible. It’s called a “least squares” because the best line of fit is one that minimizes the variance (the sum of squares of the errors). This can be a bit hard to visualize but the main point is you are aiming to find the equation that fits the points as closely as possible.
Ordinary least squares regression (OLS) is usually just called “regression” in statistics. If you are performing regression analysis, either by hand or using SPSS or Excel, you’ll actually be using the least squares method. Other techniques exist, like polynomial regression and logistic regression, but these are usually referred to by their full names and not as simply “regression.”
2. How to find a least squares regression line equation by hand
Another name for the line is “Linear regression equation” (because the resulting equation gives you a linear equation).
3. How to find a least squares regression line equation with technology
Of course, you may not want to perform the calculations by hand. There are several options to find a regression line using technology including Minitab regression and SPSS. Excel is one of the simplest (and cheapest!) options.
4. What is Least Squares Fitting?
Least squares fitting (also called least squares estimation) is a way to find the best fit curve or line for a set of points. In this technique, the sum of the squares of the offsets (residuals) are used to estimate the best fit curve or line instead of the absolute values of the offsets. The resulting equation gives you a y-value for any x-value, not just those x and y values plotted with points.
Advantages of least squares fitting
Least squares allows the residuals to be treated as a continuous quantity where derivatives (measures of how much a function’s output changes when an input changes) can be found. This is invaluable, as the point of finding an equation in the first place is to be able to predict where other points on the line (even points that are way beyond the original points) might lie.
Disadvantages of Least Squares Fitting
Outliers can have a disproportionate effect if you use the least squares fitting method of finding an equation for a curve. This is because the squares of the offsets are used instead of the absolute value of the offsets; outliers naturally have larger offsets and will affect the line more than points closer to the line. These disproportionate values may be beneficial in some cases.
Types of Least Squares Fitting
The most common type of least squares fitting in elementary statistics is used for simple linear regression to find the best fit line through a set of data points.
Least squares fitting is also used for nonlinear parameters. However, this technique can get complicated — least squares fitting may have to be applied over and over again (“iteratively”) until an appropriate fit is achieved. You’ll rarely encounter this type of least squares fitting in elementary statistics, and if you do — you’ll use technology like SPSS to find the best fit equation.
5. Ordinary Least Squares
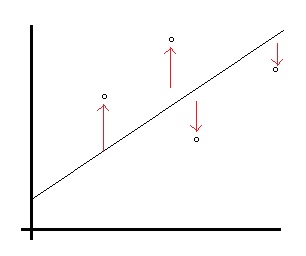
Ordinary least squares regression is a way to find the line of best fit for a set of data. It does this by creating a model that minimizes the sum of the squared vertical distances (residuals).
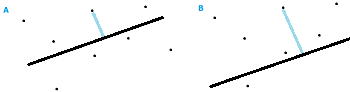
The distances are squared to avoid the problem of distances with a negative sign. Then the problem just becomes figuring out where you should place the line so that the distances from the points to the line are minimized. In the following image, the best fit line A has smaller distances from the points to the line than the randomly placed line B.
Calculating Ordinary Least Squares Regression
Ordinary least squares regression uses simple linear regression to find the best fit line. If you’re using technology (i.e. SPSS), look for “Linear Regression” as an option.
If your data doesn’t fit a line, you can still use Ordinary Least Squares regression, but the model will be non-linear. You’ll probably want to use software for calculating non-linear equations.
Assumptions for Ordinary Least Squares Regression
In order for OLS regression to work properly, your data should fit several assumptions:
- Your model should have linear parameters.
- Your data should be a random sample from the population. In other words, the residuals should not be connected or correlated to each other in any way.
- The independent variables should not be strongly collinear.
- The residuals’ expected value is zero.
- The residuals have homogeneous variance.
- The residuals follow a normal distribution.
- The independent variables have been measured accurately (if they aren’t, small errors in measurement could result in huge errors for your OLS regression).
Partial Least Squares
Partial Least Squares Regression is used to predict trends in data, much in the same way as Multiple Regression Analysis. Where PLS regression is particularly useful is when you have a very large set of predictors that are highly collinear (i.e. they lie on a straight line). With these two constraints, Multiple Regression Analysis is not useful. What usually happens is that if the number of factors is greater than the number of observations, the Multiple Regression model could fit the sample data perfectly but will be unable to predict anything. This phenomenon, called “over-fitting,” is addressed and corrected by Partial Least Squares Regression. The technique tackles over-fitting by:
- Reducing the predictors to a smaller set of uncorrelated components. These components are mapped in a new space.
- Performing least squares fitting on the new set of components.
PLS Regression can also be useful if Ordinary Least-Squares Regression fails to produce any results, or produces components with high standard errors.
Partial Least Squares Regression also bears some similarity to Principal Component Analysis. However, the emphasis with PLS Regression is on prediction and not understanding the relationship between the variables. Although it can be used across a wide range of disciplines, it is popularly used in chemometrics for modeling linear relationships between sets of multivariate measurements.
As PLS Regression is focused primarily on prediction, it is one of the least restrictive multivariate analysis methods. For example, if you have fewer observations than predictor variables, you wont be able to use discriminant analysis or Principal Components Analysis. However, PLS regression can be used in this and many other situations where other multivariate analysis tools aren’t suitable.
Projection to Latent Structures
An alternative name for Partial Least Squares Regression is Projection to Latent Structures. According to Herman Wold, the statistician who developed the technique, Projection to Latent Structures is a more correct term for describing what that technique actually does. However, the term Partial Least Squares Regression remains in popular use.
References
Lindstrom, D. (2010). Schaum’s Easy Outline of Statistics, Second Edition (Schaum’s Easy Outlines) 2nd Edition. McGraw-Hill Education
Levine, D. (2014). Even You Can Learn Statistics and Analytics: An Easy to Understand Guide to Statistics and Analytics 3rd Edition. Pearson FT Press
Wold et al.: “PLS-regression: a basic tool of chemometrics”, Chemometrics and Intelligent Laboratory Systems, 58, 109-130, 2001.