Contents:
Mean Squared Error Definition
The mean squared error (MSE) tells you how close a regression line is to a set of points. It does this by taking the distances from the points to the regression line (these distances are the “errors”) and squaring them. The squaring is necessary to remove any negative signs. It also gives more weight to larger differences. It’s called the mean squared error as you’re finding the average of a set of errors. The lower the MSE, the better the forecast.
Mean Squared Error Example
MSE formula = (1/n) * Σ(actual – forecast)2
Where:
- n = number of items,
- Σ = summation notation,
- Actual = original or observed y-value,
- Forecast = y-value from regression.
General steps to calculate the MSE from a set of X and Y values:
- Find the regression line.
- Insert your X values into the linear regression equation to find the new Y values (Y’).
- Subtract the new Y value from the original to get the error.
- Square the errors.
- Add up the errors (the Σ in the formula is summation notation).
- Find the mean.
Example Problem: Find the MSE for the following set of values: (43,41), (44,45), (45,49), (46,47), (47,44).
Step 1: Find the regression line. I used this online calculator and got the regression line y = 9.2 + 0.8x.
Step 2: Find the new Y’ values:
- 9.2 + 0.8(43) = 43.6
- 9.2 + 0.8(44) = 44.4
- 9.2 + 0.8(45) = 45.2
- 9.2 + 0.8(46) = 46
- 9.2 + 0.8(47) = 46.8
Step 3: Find the error (Y – Y’):
- 41 – 43.6 = -2.6
- 45 – 44.4 = 0.6
- 49 – 45.2 = 3.8
- 47 – 46 = 1
- 44 – 46.8 = -2.8
Step 4: Square the Errors:
- -2.62 = 6.76
- 0.62 = 0.36
- 3.82 = 14.44
- 12 = 1
- -2.82 = 7.84
This table shows the results so far:
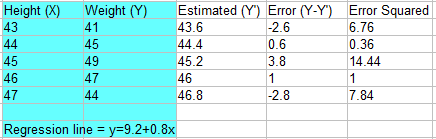
Step 5: Add all of the squared errors up: 6.76 + 0.36 + 14.44 + 1 + 7.84 = 30.4.
Step 6: Find the mean squared error:
30.4 / 5 = 6.08.
What does the Mean Squared Error Tell You?
The smaller the mean squared error, the closer you are to finding the line of best fit. Depending on your data, it may be impossible to get a very small value for the mean squared error. For example, the above data is scattered wildly around the regression line, so 6.08 is as good as it gets (and is in fact, the line of best fit). Note that I used an online calculator to get the regression line; where the MSE really comes in handy is if you were finding an equation for the regression line by hand: you could try several equations, and the one that gave you the smallest MSE would be the line of best fit.
MSE Criterion
Sometimes, a statistical model or estimator must be “tweaked” to get the best possible model or estimator. The MSE criterion is a tradeoff between (squared) bias and variance and is defined as:
“T is a minimum [MSE] estimator of θ if MSE(T, θ) ≤ MSE(T’ θ), where T’ is any alternative estimator of θ (Panik).”
References:
Michael Panik. Endocrine Manifestations of Systemic Autoimmune Diseases.