Excel for statistics > How to Load the Microsoft Excel Data Analysis ToolPak
Contents (click to skip to that section):
- Load the Excel Data Analysis Toolpak in Excel 2013-current
- Load the Excel Data Analysis ToolPak in Excel 2007-2010
- Notes on using the ToolPak
- What’s included in the Toolpak?
How to Load the Data Analysis Toolpak in Excel 2013-2016
Watch the video for the steps:
The Data Analysis Toolpak is included with every copy of Excel. It gives you access to a wide variety of statistical functions including histograms, correlation, a range of z-test and t-test functions and a random number generator. Once you load the Data Analysis Toolpak you can access it by clicking “Data Analysis” in the “Data” tab.
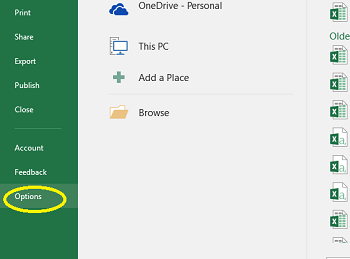
Step 1: Click the “File” tab and then click “Options.” The Options window will open.
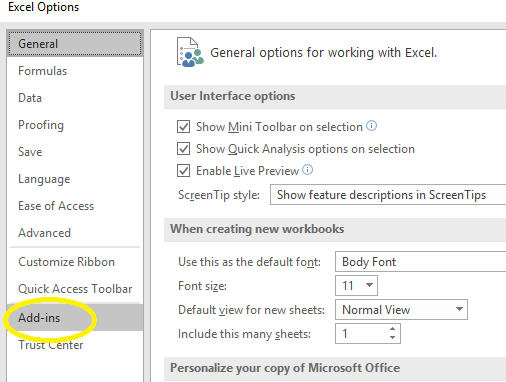
Step 2: Click “Add-Ins.” Add-Ins is listed at the bottom of the left-hand column.
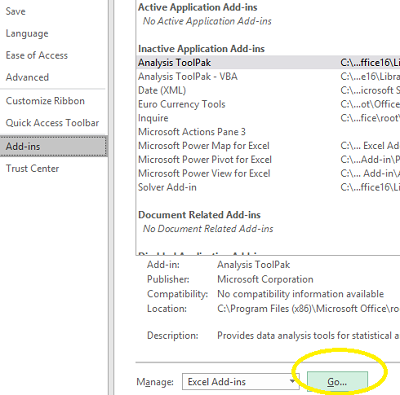
Step 3: Click the “Go” button, next to Manage Excel Add-Ins. Manage Excel Add-Ins is at the very bottom of the pop up window, underneath the list of Add-In options.
Step 4: Check the “Data Analysis Toolpak” check box.
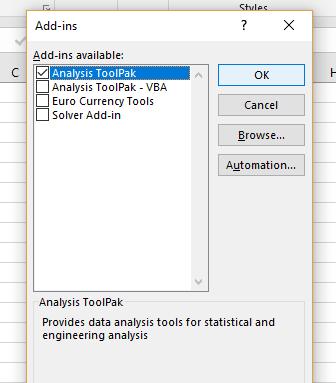
Step 5: Click “OK.” The Data Analysis Toolpak is now loaded into Excel.
Step 6: Click the “Data” tab and then click “Data Analysis” —located at the far right of the Toolbar in the Analysis group— to access the Toolpak.
How to Load the Microsoft Excel Data Analysis ToolPak: Excel 2007-2010
The Data Analysis ToolPak is added from the Office menu.
Step 1: Click the “Office” button at the top left (with the Microsoft logo) and then click “Excel Options.”
Step 2: Next, click “Add-Ins,” then select “Excel Add-Ins” in the Manage box.
Step 3: Click “Go,” then click the “Analysis ToolPak” check box.
Step 4: Finally, click “OK.” The Data Analysis ToolPak is now ready for use in the “Data” tab.
Notes on Using the Toolpak
Excel has bugs with stats calculations, especially things like f-tests. So if you’re going to use Excel for stats, make sure you know the limitations of the ToolPak. Want more information? See this article on using Excel for Stats.
Another small quirk is that data analysis functions only work on one worksheet at a time. If you have a group of worksheets, you’ll get blank tables on them. This isn’t an error, per se, but you will have to run analysis on each single worksheet.
Check out our YouTube channel for more Excel/stats help and tips!
What’s Included with the Toolpak?
Anova
Single factor and two-factor with replication. Basically, you’re testing groups to see if there’s a difference between them.
Correlation
CORREL and PEARSON measure relations between variables.
Covariance
Tells you how much two random variables vary together. It’s similar to variance, but where variance tells you how a single variable varies, co variance tells you how two variables vary together.
Descriptive Statistics
Gives a report of univariate stats for your data (e.g. the mean and median).
Exponential Smoothing
A prediction tool for time series data. The older the data, the less priority (“weight”); more weight is given to newer data.
F-Test Two-Sample for Variances
A test to compare two population variances.
Fourier Analysis
A dual purpose tool that can:
- Problem solve linear systems.
- Analyse periodic data.
Histogram
Creates a histogram from your data. If you have Excel 2016, you can create Pareto diagrams as well.
Moving Average
Predicts future performance based on averages from past data.
Random Number Generation
Generates columns of independent random numbers.
Rank and Percentile
Calculates ordinal and percentage rank.
Regression
Performs least squares regression on a set of data.
Sampling
Takes a sample from a “population” that you input.
t-Test
A group of tools to compare means between groups. See: T-test in Excel.
z-Test
A tool to compare means between groups.
References
Beyer, W. H. CRC Standard Mathematical Tables, 31st ed. Boca Raton, FL: CRC Press, pp. 536 and 571, 2002.
Klein, G. (2013). The Cartoon Introduction to Statistics. Hill & Wamg.
Vogt, W.P. (2005). Dictionary of Statistics & Methodology: A Nontechnical Guide for the Social Sciences. SAGE.
Wheelan, C. (2014). Naked Statistics. W. W. Norton & Company