Contents:
What is Fourier Analysis?
Fourier Analysis is an extension of the Fourier theorem, which tells us that every function can be represented by a sum of sines and cosines from other functions. In other words, the analysis breaks down general functions into sums of simpler, trigonometric functions; The Fourier series tells you what the amplitude and the frequency of the sines and cosines are.
Fourier Analysis is a useful tool for studying phenomena like sound or neural pathways and is commonly used in everyday items like cell phones, DVDs and JPEGs.
Fourier Analysis Excel: Overview.
 The Analysis converts a single set of data points into a second, equal size set of data points. The Fourier analysis Excel tool has a couple of limitations:
- The maximum number of points is 4,096
- The data points must be in powers of two. In other words, you can only enter 2,4,8,16,32,64,128…4,096 numbers.
If your data set contains fewer numbers (i.e. 5 or 30), pad the data set with extra zeros (to make 8 or 32) so that you can run the Fourier analysis tool.
How to run Fourier Analysis Excel 2013 & Newer: Steps
Step 1: Type your data into a single column (it only works on a single column of Data).
Step 2: Click the “Data” tab and then click “Data Analysis.” If you don’t see that option, load the Data Analysis Toolpak.
Step 3: Click “Fourier Analysis” and then click “OK.”
Step 4: Type a range for your data into the Input Range box. For example, if your data is in cells J1 to J16, type “J1:J16” into that box.
Step 5: Check the “Labels in first row” box if you have column headers (so that Excel knows to exclude that row).
Step 6: Click in the Output Range box and then select an area immediately to the right of your data. You can also check “New Worksheet,” but having the Fourier Analysis results right next to your data will be more useful.
Step 7: Check the “Inverse” box only if you have results from a prior analysis and you want to find the original function.
Step 8: Click “OK.”
Tip: An “i” in the results means a complex number. If you see a green triangle, it means the data has been converted to text. Click the cell, click the error message and choose “Convert to Number.”
Fourier Series
Any periodic function can be represented by a Fourier Series— a sum (an infinite series) of sines and cosines:
f(x) = A0 a1 cos x + a2 cos 2x +… + b1 sin x + b2 sin 2x +…
Each term is a periodic function with period 2π. Therefore, the sum of the series also has a period of 2π. The period can be replaced by one of arbitrary length, with the only issue being that the formulas will become a little more complicated to work with (Jackson, 2004).
Fourier series are useful in a wide range of fields including acoustics, with representation of musical sounds as sums of waves of various frequencies (Nearing, 2020) or quantum mechanics, for the quantum wave function of a particle in a box.
Example of a Fourier Series Approximation
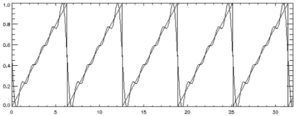
A Sawtooth function, with period 1 and peak-to-peak amplitude of 1 can be represented fairly well by the Fourier series
S = 0.5 – 0.31831*sin(t) – 0.159155*sin(2*t) – 0.106103 * sin(3 * t)- 0.0795775 * sin(4 * t) – 0.0636620 * sin(5 * t) (Schmahl, 2020):

Fourier Series vs. Taylor Series
These two series are both infinite expansions, but otherwise they are very different.
- The Taylor series rewrites a general function as an infinite series of powers,
- A Fourier series rewrites a function as an infinite series of sines and cosines.
The Taylor series expands a function, analytic in the neighborhood of some point x = a. The coefficients in the series are found by taking successive derivatives at point a:
![]()
The Taylor series is restricted to functions which can be differentiated to any degree, while the Fourier series doesn’t have this restriction. Fourier series also don’t have to meet the condition of continuity, and can be discontinuous at any number of finite points (Lanczos, 2016).
References
Jackson, D. (2004). F, Series and Orthogonal Polynomials. Dover Publications; Illustrated edition.
Lanczos, C. (2016). Discourse on F. Series. SIAM-Society for Industrial and Applied Mathematics.
Nearing, J. (2020). Fourier Series. Retrieved November 13, 2020 from: http://www.physics.miami.edu/~nearing/mathmethods/fourier_series.pdf
Peacock, J. (2013). Fourier Analysis. Retrieved November 13, 2020 from: https://physics.csuchico.edu/buchholtz/301A/Fourier.pdf
Schmahl, E. (1999). Examples of Fourier Series. Retrieved November 13, 2020 from: https://hesperia.gsfc.nasa.gov/~schmahl/fourier_tutorial/node2.html
Check out our YouTube channel for more help and tips!
I expect that the output complex result requires determining the absolute value, separating the real part and the absolute part and normalizing by the amplitude to obtain Acos(w) and Bcos(w) and the bandwidth is 2/N
I will check this out. I wish you had a direct example as to how to use the result.
From the results of complex numbers, if i calculate the angle phi, it does not match with the required results. Please clarify on this issue
Prakash,
Can you please give an example of your input and the “required” results. I’ll take a look. Thank you.
I’m running MS Excel 2013. It appears that the first result value (DC offset) must be divided by the Total Number of Samples to get the correct Magnitude. Also, each remaining result must be divided by 1/2 the Total Number of Samples. Except for the DC Offset, the results with the correct phasing appear to be in the last half of the results.