Probability Distributions > Tukey Lambda Distribution
What is the Tukey Lambda Distribution?
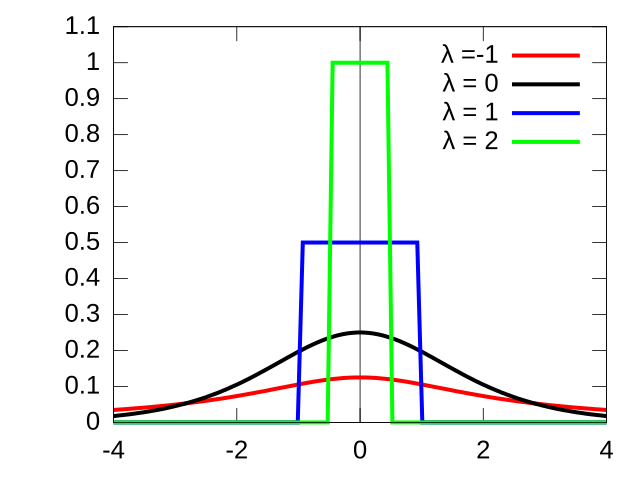
The Tukey lambda distribution, also called the symmetric lambda distribution, is a family of symmetric distributions with truncated tails. Typically, it aids in identification of an appropriate distribution and is not directly used in statistical modeling. This is because it lacks a general form of a probability density function (pdf) or cumulative distribution function (CDF). However, there are some useful special cases, which include approximating other distributions.
Tukey lambda distribution properties
The distribution is defined numerically with three parameters:
- λ, the shape parameter,
- μ, the location parameter,
- σ, the scale parameter.
Unlike most other probability distributions, there isn’t a “one size fits all” formula for the probability density function (pdf) and cumulative distribution function (CDF). You’ll usually see it defined in terms of quantiles [2, 3] or the following distribution function:
The following image shows two vastly different shapes for λ values of 0.5 and 5.0:
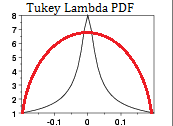
So although there isn’t one general PDF for all possible values of λ, a pdf can easily be generated for specific values once you know the percentile function.
GLD and the Percentile Function
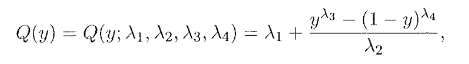
The generalized lambda distribution is usually defined in terms of its four-parameter percentile function:
 .
.
Where:
0 ≤ y ≤ 1
and
- λ1, the location parameter,
- λ2, the scale parameter,
- λ3, skewness,
- λ4, kurtosis.
Uses
Not surprisingly, the Tukey Lambda isn’t used for statistical modeling due to the lack of an easily definable pdf or CDF. It’s main use is to approximate other symmetric probability distributions such as:
- Approximately a Cauchy distribution (λ = -1)
- Approximately a normal distribution (λ = 0.14)
- U-Shaped Distribution (λ = 0.5)
It is also an exact match for some distributions, including:
- Logistic distribution (λ = 0)
- Uniform distribution (λ = -1 to 1)
Another common use for the Tukey lambda distribution is to generate PPCC plots, where the software processes inputted data to suggest models via a technique such as the Tukey-Lambda PPCC plot (Probability Plot Correlation Coefficient Plot).
Origins
Tukey’s lambda distribution was first proposed by John Tukey in 1960 [4], although it was based on 1947 work by Hastings et. al [5]. In the early 1970s the distribution was generalized by John Ramberg and Bruce Schmeiser [2] for use in Monte Carlo simulations;
Ramberg and colleagues went on to develop the curve-fitting properties of the distribution in the late 70’s [6]. After you have fit the curve, you can then model the residuals from that curve. Curve fitting algorithms include: gradient descent, Gauss-Newton and the Levenberg–Marquardt algorithm.
Tukey-Lambda PPCC Plot
One of the more common uses for the Tukey-Lambda distribution is in PPCC plot generation. A Tukey-Lambda PPCC plot (Probability Plot Correlation Coefficient Plot) is generated by software and is based on a set of inputted data. The plot results in a suggested model for the data.
References
- IkamusumeFan, CC BY-SA 4.0, via Wikimedia Commons
- Ramberg, J. and Schmeiser, B. (1972) An Approximate Method for Generating Symmetric Random Variables. Communications of the ACM, 15, 987-990. https://doi.org/10.1145/355606.361888
- Ramberg, J., et al. (1979) A Probability Distribution and Its Uses in Fitting Data. Technometrics, 21, 201-214.
- Tukey, J. (1960). The Practical Relationship Between the Common Transformations of Percentages of Counts and Amounts, Technical Report 36. Statistical Techniques Research Group, Princeton University.
- Hastings, C. et. al (1947). Low moments for small samples: a comparative study of statistics. Annals of Mathematical Statistics, 18, 413-426.
- Ramberg, J. et. al. (1979). A probability distribution and its uses in fitting data. Technometrics, 21(2):201-214, May 1979.