Probability Distributions > U-Shaped Distribution
U-Shaped Distribution
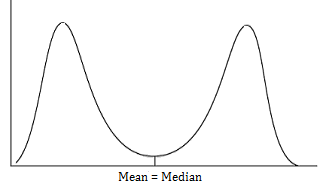
A U-Shaped distribution is a bimodal distribution with frequencies that steadily fall and then steadily rise. There is a higher chance of a measurement being found at the extremes than in the center of the distribution. Cyclical and sinusoidal measurements are usually in distributed in U-shapes (Bucher, 2012).
In some ways, this distribution can be thought of as an upside down bell curve. However, a U-shaped distribution can’t be turned into a bell curve by a meaningful transformation, even if it is perfectly symmetric (Iversen & Norpoth, 1987).
A symmetric U-shaped distribution has the following characteristics:
- Tails are equal on both sides.
- Coefficient of skewness is zero.
- The mean is less than the highest mode.
- The mean is equal to the median.
- Quartiles are defined as (Q3 – Md) = Md – Q1). In other words, the difference between the third quartile and the median equals the difference between the first quartile and the median.
Uses and Examples
U-shaped distributions have been noted for more than a hundred years. Pearson (1895) stated that U-shaped curves, because of the prevalence of extremes, may appear in meteorological phenomena and competitive exams, where “…the mediocre have occasionally sufficient wisdom to refrain from entering.”

- Beginning-Ending list bias is U-shaped. Given a large number of choices, people tend to choose items at the beginning or ending of a list (Mangione, 1995). Rating scales from 1 to 5 or 1 to 10 can be particularly subject to this type of bias, like product reviews — where people who rate an item either love or hate it.
- U-shaped distributions can happen when an item or topic is controversial.
- Francis Galton’s curve of consumptivity has a u-shape. Consumption (a wasting disease like tuberculosis) tended to kill the very young or very old at greater rates than those in between.
- The Barthel Index is U-shaped; indexes like this are sometimes called bounded scores in the medical literature (Everitt, 2005).
- The Bathtub curve, which models failure rates, is U-shaped.
- Magazine readership often results in a U-shape graph; people either subscribe and read every issue, or only read a single copy.
References:
Bucher, J. (2012). The Metrology Handbook, Second Edition. ASQ Quality Press.
Everitt, B. (2005). U-Shaped Distribution. Retrieved January 29, 2017 from: http://onlinelibrary.wiley.com/doi/10.1002/0470011815.b2a15171/abstract
Iversen, G. & Norpoth, H. (1987). Analysis of Variance 1st Edition. SAGE.
Mangione, T. (1995). Mail Surveys: Improving the Quality. Book 40 in Applied Social Research Methods. SAGE Publications, Inc; 1 edition.
Pearson,K. (1895) Contributions to the mathematical theory of evolution. In Philosophical Transactions of the Royal Society of London. Vol. 180A. p. 174.