What is a Residual in Regression?
Watch the video for an overview of residuals in regression analysis, or read on below.
Can’t see the video? Click here to watch it on YouTube.
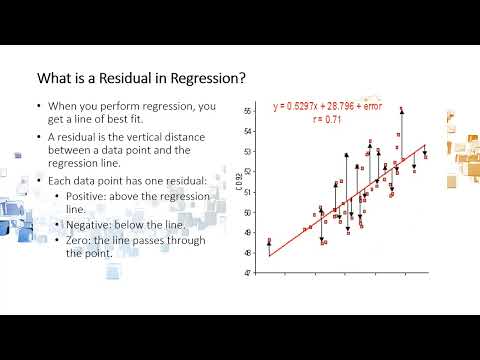
When you perform simple linear regression (or any other type of regression analysis), you get a line of best fit. The data points usually don’t fall exactly on this regression equation line; they are scattered around. A residual is the vertical distance between a data point and the regression line. Each data point has one residual. They are:
- Positive if they are above the regression line,
- Negative if they are below the regression line,
- Zero if the regression line actually passes through the point,
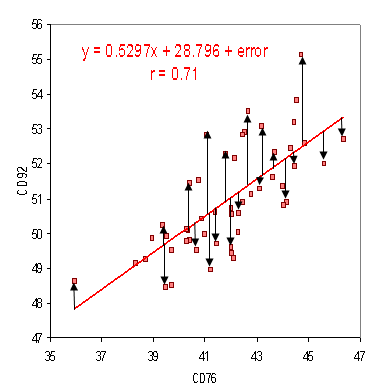
As residuals are the difference between any data point and the regression line, they are sometimes called “errors.” Error in this context doesn’t mean that there’s something wrong with the analysis; it just means that there is some unexplained difference. In other words, the residual is the error that isn’t explained by the regression line.
The residual(e) can also be expressed with an equation. The e is the difference between the predicted value (ŷ) and the observed value. The scatter plot is a set of data points that are observed, while the regression line is the prediction.
e = y – ŷ
The Sum and Mean of Residuals
The sum of the residuals always equals zero (assuming that your line is actually the line of “best fit.” If you want to know why (involves a little algebra), see this discussion thread on StackExchange. The mean of residuals is also equal to zero, as the mean = the sum of the residuals / the number of items. The sum is zero, so 0/n will always equal zero.
Next: Standardized Residuals.
Check out our YouTube channel for hundreds of help videos on elementary statistics!
References
Dodge, Y. (2008). The Concise Encyclopedia of Statistics. Springer.
Gonick, L. (1993). The Cartoon Guide to Statistics. HarperPerennial.
Vogt, W.P. (2005). Dictionary of Statistics & Methodology: A Nontechnical Guide for the Social Sciences. SAGE.
Wheelan, C. (2014). Naked Statistics. W. W. Norton & Company