Post Hoc Tests > Scheffe Test
What is the Scheffe Test?
The Scheffe Test (also called Scheffe’s procedure or Scheffe’s method) is a post-hoc test used in Analysis of Variance. It is named for the American statistician Henry Scheffe. After you have run ANOVA and got a significant F-statistic (i.e. you have rejected the null hypothesis that the means are the same), then you run Sheffe’s test to find out which pairs of means are significant. The Scheffe test corrects alpha for simple and complex mean comparisons. Complex mean comparisons involve comparing more than one pair of means simultaneously.
Out of the three mean comparisons test you can run (the other two are Fisher’s LSD and Tukey’s HSD). The Scheffe test is the most flexible, but it is also the test with the lowest statistical power. Deciding which test to run largely depends on what comparisons you’re interested in:
- If you only want to make pairwise comparisons, run the Tukey procedure because it will have a narrower confidence interval.
- If you want to compare all possible simple and complex pairs of means, run the Scheffe test as it will have a narrower confidence interval.
Calculating the Test
Only run this test if you have rejected the null hypothesis in an ANOVA test, indicating that the means are not the same. Otherwise, the means are equal and so there is no point in running this test.
- The null hypothesis for the test is that all means are the same: H0: μi = μj.
- The alternate hypothesis is that the means are not the same: H0: μi ≠ μj.
This test is usually calculated with software. Like most statistical tests, you find a critical value and then compare it with a test statistic. Reject the null hypothesis if the Scheffe test statistic is greater than the critical value.
The steps that follow are for calculating simple pairwise comparisons by hand for four samples A B C and D. You’ll need descriptive statistics data (the sample means) plus data from ANOVA (like mean squared error).
Sample Means for Samples ABCD:
- A = 36.00,
- B = 34.50,
- C = 35.60,
- D = 36.21.
ANOVA Data (from the ANOVA output)
- F-value = 3.24 (from the f-table, with 3 numerator degrees of freedom and 16 denominator degrees of freedom at an α of 0.05).
- Mean Squared Error: 0.028.
Steps
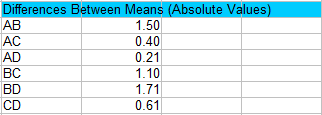
Step 1: Calculate the absolute values of pair wise differences between sample means. You’ll have to figure out all the possible combinations. For four samples, there are 6 possible combinations of two: AB AC AD BC BD and CD.
For example, for AB the absolute difference (|A-B|) is 36.00 – 34.50 = 1.50.
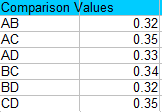
Step 2: Use the following formula to find a set of Scheffe formula values (you will use these in the next Step):
![]()
Where:
- (k – 1) is the between samples degrees of freedom. For this set of data, that’s 3 (4 – 1 = 3).
- f , 1 * n − k k − ; α = the f-value (from ANOVA). For this set of data, the f-value is 3.24.
- MSE = mean square error (from ANOVA).
It’s easier than it looks! Once you’ve found the df and MSE from your ANOVA output, you only need to change the sample sizes in the formula for each comparison. (The sample sizes are A = 5, B = 6, C = 4, D = 5).
For example, comparing A and B we get:
√(3 * 3.24 * 0.028 *(1/5 + 1/6)) = 0.32.
And comparing A and C we get:
√(3 * 3.24 * 0.028 *(1/5 + 1/4)) = 0.35.
Step 3: Compare the values in Step 1 to the values in Step 2 and find any values that are larger than the comparison values. Larger values are statistically significant at your chosen alpha level (in this case, 0.05). For this example, the only value that isn’t significant is AD, because 0.21 is smaller than 0.33.
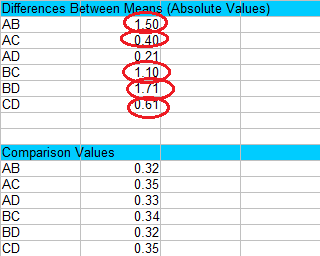
That’s it!
References
Henry Scheffé. (1999). The Analysis of Variance. John Wiley & Sons.