Statistics Definitions > Summary Statistics

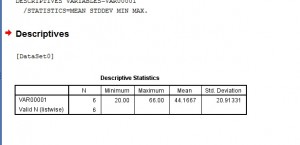
Summary statistics summarize and provide information about your sample data. It tells you something about the values in your data set. This includes where the mean lies and whether your data is skewed. Summary statistics fall into three main categories:
- Measures of location (also called central tendency).
- Measures of spread.
- Graphs/charts.
Summary Statistics: Measures of location
Measures of location tell you where your data is centered at, or where a trend lies. Click on one of the following common measures of location for a full definition and examples for that particular measure:
- Mean (also called the arithmetic mean or average).
- Geometric mean (used for interest rates and other types of growth).
- Trimmed Mean (the mean with outliers excluded).
- Median (the middle of a data set).
Summary Statistics: Measures of Spread
Measures of spread tell you (perhaps not surprisingly!) how spread out or varied your data set is. This can be important information. For example, test scores that are in the 60-90 range might be expected while scores in the 20-70 range might indicate a problem. Range isn’t the only measure of spread though. Click on one of the names below for a full definition of that particular measure of spread.
- range (how spread out your data is).
- Interquartile range (where the “middle fifty” percent of your data is).
- Quartiles (boundaries for the lowest, middle and upper quarters of data.
- Skewed (does your data have mainly low, or mainly high values?).
- Kurtosis (a measure of how much data is in the tails).
Summary Statistics: Graphs and Charts
There are literally dozens of ways to display summary data using graphs or charts. Some of the most common ones are listed below. Click on any name for a definition of that particular chart type.
Check out our YouTube channel for hundreds of basic elementary statistics videos!
References
Hand, D. (2008). Statistics: A Very Short Introduction 1st Edition. Oxford University Press.