- Quartiles: definition, finding
- Upper and lower quartiles
- Quartile function in Excel
- Difference between a quarter and a quartile
What are Quartiles? Definition
Watch the video below for a brief overview on quartiles or keep reading:

Can’t see the video? Click here to watch it on YouTube.
Quartiles are values that divide your data into quarters. However, quartiles aren’t shaped like pizza slices; Instead they divide your data into four segments according to where the numbers fall on the number line. The four quarters that divide a data set into quartiles are:
-
- The lowest 25% of numbers.
- The next lowest 25% of numbers (up to the median).
- The second highest 25% of numbers (above the median).
- The highest 25% of numbers.
 As quartiles divide numbers up according to where their position is on the number line, you have to put the numbers in order before you can figure out where the quartiles are.
What do quartiles in statistics tell us?
If Q1 is further away from the median than Q3 is from the median, it tells us that there is a greater dispersion among smaller values in the dataset compared to the larger values. The opposite is true if Q3 is farther away from Q2 than Q1 is from the median: that means there is greater dispersion among larger values compared to smaller values.
Quartiles are used to compute the interquartile range — a measure of variability around the median. The interquartile range is obtained by subtracting the first quartile from the third quartile: Q3 – Q1. It represents the range of the middle half of the data, providing insights into the overall spread of data.
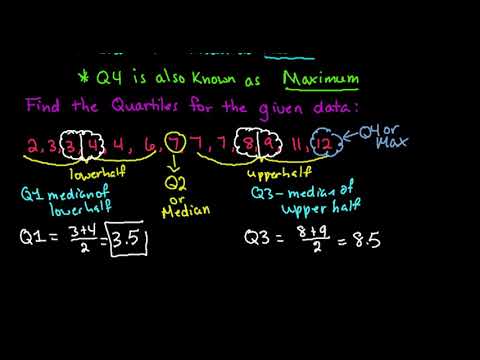
How to calculate quartiles in statistics
- Order the numbers: 2, 5, 6, 7, 10, 12, 13, 14, 16, 22, 45, 65.
- Find the median (Q2). We have 12 numbers, and the median splits the data into two halves.
- 2, 5, 6, 7, 10, 12 (Q2) 13, 14, 16, 22, 45, 65.
- Q2 is the average of 12 and 13, so (12 + 13) / 2 = 12.5.
- 2, 5, 6, 7, 10, 12 (Q2 = 12.5) 13, 14, 16, 22, 45, 65.
- Find the median of the lower half of numbers, to get Q1. (6 + 7) / 2 = 6.5:
- 2, 5, 6, (Q1 = 6.5) 7, 10, 12 (Q2 = 12.5) 13, 14, 16, 22, 45, 65.
- Find the median of the upper half of numbers, to get Q3. (16 + 22) / 2 = 19:
- 2, 5, 6, (Q1 = 6.5) 7, 10, 12 (Q2 = 12.5) 13, 14, 16, (Q3 = 19) 22, 45, 65.
If you have an uneven set of numbers, such as the set {6, 7, 1, 9, 8, 4, 2), follow this procedure instead:
- Order the numbers: 1, 2, 4, 6, 7, 8, 9.
- Find the median (Q2): this the number dead in the center:
- 1, 2, 4, [Q2 = 6], 7, 8, 9.
- Find the median of the lower half. In this example, this is the number dead in the center of 1, 2, 4:
- 1, [Q1 = 2], 4, [Q2 = 6], 7, 8, 9.
- Repeat step 3 to find the median of the upper half (7, 8, 9): [Q1 = 2], 4, [Q2 =6], 7, [Q3 = 8], 9.
While the above procedure works, you may want to use the lower and upper quartile formulas for larger data sets.
Upper and lower quartiles
The upper quartile (sometimes called Q3) is the number dividing the third and fourth quartile. The upper quartile can also be thought of as the median of the upper half of the numbers. The upper quartile is also called the 75th percentile; it splits the lowest 75% of data from the highest 25%.

You can find the upper quartile by placing a set of numbers in order and working out Q3 by hand, or you can use the upper quartile formula. If you have a small set of numbers (under about 20), by hand is usually the easiest option. However, the formula works for all sets of numbers, from very small to very large. You may also want to use the formula if you are uncomfortable with finding the median for sets of data with odd or even numbers.
Example question: Find the upper quartile for the following set of numbers: 27, 19, 5, 7, 6, 9, 15, 12, 18, 2, 1.
By Hand
- Put your numbers in order: 1, 2, 5, 6, 7, 9, 12, 15, 18, 19, 27
- Find the median: 1, 2, 5, 6, 7, 9, 12, 15, 18, 19, 27.
- Place parentheses around the numbers above the median. 1, 2, 5, 6, 7, 9, (12, 15, 18, 19, 27).
- Find the median of the upper set of numbers. This is the upper quartile: 1, 2, 5, 6, 7, 9, (12, 15, 18 ,19 ,27).
Using the Formula
The upper quartile formula is:
Q3 = ¾(n + 1)th Term.
The formula doesn’t give you the value for the upper quartile, it gives you the place. For example, the 5th place, or the 76th place.
- Put your numbers in order: 1, 2, 5, 6, 7, 9, 12, 15, 18, 19, 27. Note: for very large data sets, you may want to use Excel to place your numbers in order. See: Sorting Numbers in Excel.
- Work the formula. There are 11 numbers in the set, so:
- Q3 = ¾(n + 1)th Term.
- Q3 = ¾(11 + 1)th Term.
- Q3 = ¾(12)th Term.
- Q3 = 9th Term.
In this set of numbers (1, 2, 5, 6, 7, 9, 12, 15, 18, 19, 27), the upper quartile (18) is the 9th term, or the 9th place from the left.
The lower quartile
The lower quartile (sometimes called Q1) is the number dividing the first and second quartile. The lower quartile formula is [1]
Q1 = ¼(n + 1)th Term.
The formula gives you the place. For example, the 7th or 55th place.
Example: Find the lower quartile for {27, 1, 2, 6, 4, 12, 9, 7, 15, 18, 19):
- Place the numbers in order: 1, 2, 4, 6, 7, 9, 12, 15, 18, 19, 27.
- Work the formula. There are 11 numbers, so:
- Q1 = ¼(n + 1)th Term.
- Q1 = ¼(11 + 1)th Term.
- Q1 = ¼(12)th Term.
- Q1 = 3rd Term.
- The lower quartile is the 3rd term (the 3rd place from the left): 1, 2, (Q1 = 4), 6, 7, 9, 12, 15, 18, 19, 27.
Quartile Function Excel
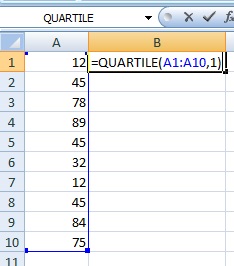
You can also find a quartile in Microsoft Excel using the Excel quartile function.
- Type your data into a single column. For example, type your data into cells A1 to A10.
- Click an empty cell somewhere on the sheet. For example, click cell B1.
- Type “=QUARTILE(A1:A10,1)” and then press “Enter”. This finds the first quartile. To find the third quartile, type “=QUARTILE(A1:A10,3)”. Note: If your data is in a different cell range other than A1:A10, make sure you change the function to reflect that.
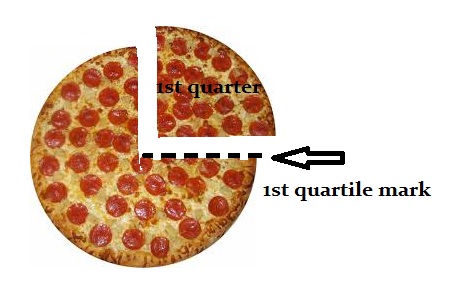
Difference between a quarter and a quartile
There’s a slight difference between a quarter and quartile. A quarter is the whole slice of pizza, but a quartile is the mark the pizza cutter makes at the end of the slice.
References
- 1.5.2 – Measures of Position. Retrieved July 24, 2023 from: https://online.stat.psu.edu/stat500/book/export/html/536