See also: What is an F-Test?
What is an F Statistic?
 An F statistic is a value you get when you run an ANOVA test or a regression analysis to find out if the means between two populations are significantly different. It’s similar to a T statistic from a T-Test; A T-test will tell you if a single variable is statistically significant and an F test will tell you if a group of variables are jointly significant. The F statistic is calculated by dividing the variance between groups by the variance within groups. The F critical value is a specific value that is used to determine whether the F statistic is statistically significant. In general, if the F statistic is greater than the F critical value, then you can reject null hypothesis; this means that there is a significant difference between the group variances.

What is “Statistically Significant”?
Simply put, if you have significant result, it means that your results likely did not happen by chance. If you don’t have statistically significant results, you throw your test data out (as it doesn’t show anything!); in other words, you can’t reject the null hypothesis.
Using The F Statistic.
You can use the F statistic when deciding to support or reject the null hypothesis. In your F test results, you’ll have both an F value and an F critical value.
- The value you calculate from your data is called the F Statistic or F value (without the “critical” part).
- The F critical value is a specific value you compare your f-value to.
In general, if your calculated F value in a test is larger than your F critical value, you can reject the null hypothesis. However, the statistic is only one measure of significance in an F Test. You should also consider the p value. The p value is determined by the F statistic and is the probability your results could have happened by chance. Back to Top
Variance in the numerator and denominator
When conducting an F-test in Excel, use the smaller variance as the denominator of the F-statistic. If you put the larger variance as the denominator, you will get an incorrect F-statistic, which may lead you to make a wrong decision about whether to reject the null hypothesis [1].
Although the Excel dialog box for the F-test doesn’t explicitly tell you which group’s variance is divided by the other, the function always divides the variance of the first group of data (specified in Variable 1 Range) by the variance of the second group (specified in Variable 2 Range). To avoid this error, check the variances carefully before running an F-test in Excel. You can also use a statistical software package that does not have this quirk.
If performing the test by hand, it doesn’t matter which variable goes in the denominator and which goes in the numerator. However, there is an advantage to placing the larger value in the denominator of the statistic [2]:
- Reject the null hypothesis if the p-value is smaller than the significance level.
- Do not reject the null hypothesis if your critical f value is smaller than your F statistic, unless you also have a small p-value.
It can become confusing when one value suggests rejecting the null hypothesis while another value suggests otherwise. For instance, let’s say an ANOVA has a p-value of 0.62 and an alpha level of 0.05. Since the p-value is high, you should not reject the null hypothesis. However, your f statistic is 4.0, exceeding the f critical value of 3.2. Does this mean you should reject the null hypothesis? The answer is no — because of the large p-value. Many authors recommend ignoring the P values for individual regression coefficients if the overall F ratio is not statistically significant. This is because of the multiple testing problem. In other words, your p-value and f-value should both be statistically significant in order to correctly interpret the results. If you want to know whether your regression F-value is significant, you’ll need to find the critical value in the f-table. For example, let’s say you had 3 regression degrees of freedom (df1) and 120 residual degrees of freedom (df2). An F statistic of at least 3.95 is needed to reject the null hypothesis at an alpha level of 0.1. At this level, you stand a 1% chance of being wrong [3]. For more details on how to do this, see: F Test. F Values will range from 0 to an arbitrarily large number. Back to Top
F Distribution
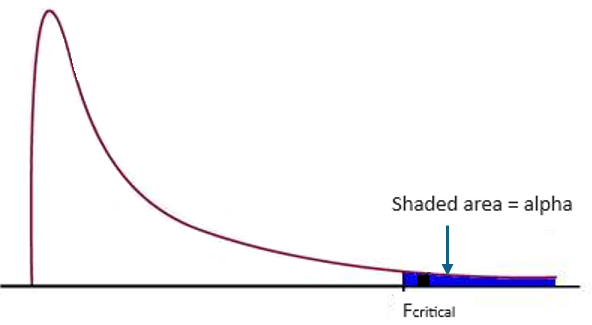
The F Distribution (also called Snedecor’s F, Fisher’s F or Fisher–Snedecor distribution) is a probability distribution of the F Statistic. In other words, it’s a distribution of all possible values of the F statistic. The distribution is important to understand when dealing with ANOVA (Analysis of Variance) tests, as it helps researchers test whether samples have the same variance and decide whether or not their results are statistically significant.

The distribution is an asymmetric distribution usually used for ANOVA . It has a minimum value of zero; there is no maximum value. The distribution’s peak happens just to the right of zero and the higher the f-value after that point, the lower the curve. The F distribution is actually a collection of distribution curves. The F distribution is related to chi-square, because the f distribution is the ratio of two chi-square distributions with degrees of freedom ν1 and ν2 (note: each chi-square is first been divided by its degrees of freedom). Each curve depends on the degrees of freedom in the numerator (dfn) and the denominator (dfd). These depend upon your sample characteristics. For example, in a simple one-way ANOVA between-groups,
- Dfn = a – 1
- dfd = N – a
where:
- a = the number of groups
- n = the total number of subjects in the experiment
The degrees of freedom in the denominator (dfd) is also referred to as the degrees of freedom error (dfe).
Usefulness in ANOVA
In order for the F-distribution to be useful in ANOVA testing, one must first understand what an “f-statistic” is. An f-statistic measures how much variation within each group versus how much variation between groups exists in a set of data being analyzed. In other words, if two groups have very similar scores on average but also have large variations within each group, then that would indicate that there isn’t much difference between them and thus no significant statistical difference can be determined from those results. On the other hand, if two groups have vastly different scores on average but small variations within each group, then that would indicate that there may be some kind of significant statistical difference between them and thus further investigation should be done to determine exactly what that difference might be. In order for researchers to determine whether or not their results are statistically significant based on their data analysis findings, they use an “F-test” which calculates an “F-Statistic” from their data set using specific formulas and then compares this number to an “F Distribution” which contains all possible values for an F statistic under various conditions (i.e., different numbers of groups being compared). If their calculated f statistic falls outside of this range then they can conclude that there is a statistically significant difference between their groups and further investigation should be done in order to determine why this might be happening (i.e., what caused these differences). This type of analysis helps researchers better understand their data by providing them with valuable insights they may not have seen before just by looking at raw numbers or charts alone. Back to Top
F Distribution Properties
The F distribution is the distribution of 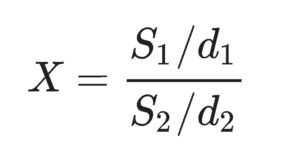 where S1 and S2 are independent random variables with chi-squared distributions and d1, d2 are their respective degrees of freedom. The probability density function (PDF) is given by
 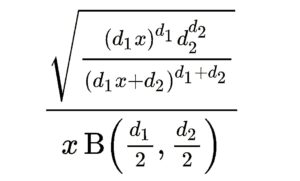 where Β is the beta function. The cumulative distribution function (CDF) is
 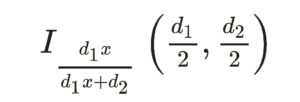 Where I is the regularized incomplete beta function. Values for the F distribution can be found in F-tables. However, most statistical software will calculate the values for you during hypothesis testing. The F Distribution is also called the Snedecor’s F, Fisher’s F or the Fisher–Snedecor distribution.
F Distribution on the TI 89: Overview
There are two types of main problem you’ll encounter with the F-Distribution you might be asked to find the area under a F curve given numerator degrees of freedom (ndf), denominator degrees of freedom (ddf), and a certain range (for example, P( 1 ≤ X ≤ 2 ), or you might be asked to find the F value with area to the left, a certain ndf and ddf (useful for finding critical values for hypotheses tests).
F Distribution on TI 89: Steps
Example problem: find the area under a F curve with numerator degrees of freedom (ndf) 4 and denominator degrees of freedom (ddf) 10 for For, P( 1≤ X ≤ 2 ):
- Press APPS.
- Press ENTER twice to get to the list entry screen.
- Press F5 for “F5-Distr.”
- Scroll down to “A:F Cdf” and press ENTER.
- Enter 1 in the box for “Lower Value,” then press the down arrow key.
- Enter 2 in the box for “Upper Value,” then press the down arrow key.
- Enter 4 in the “Num df” box, then press the down arrow key.
- Enter 5 in the “Den df” box.
- Press ENTER. The calculator will return .281 as the answer.
Example problem: to find the F value with area to the left, with ndf = 5, ddf = 8, and an area of .99:
- Press APPS.
- Press ENTER twice to get to the list entry screen.
- Press F5 for “F5-Distr.”
- Press 2 for “Inverse.”
- Press 4 for “Inverse F…,” then press ENTER.
- Enter .99 in the “Area” box, then press the down arrow key.
- Enter 5 in the “Num df,” box, then press the down arrow key.
- Enter 8 in the “Den df.” box, then press ENTER. This returns the answer (63183).
Tip: For P( X ≥ 1 ), enter 1 in the box for Lower Value and 10 ^ 99 in the box for Upper Value, and for For P( X ≤ 1 ), enter 0 in the box for Lower Value, then enter 1 in the box for Upper Value. Lost your guidebook? You can download one from the TI website here.
The F Statistic Table
The F Table is a collection of tables that give you the probability for a certain alpha level. The F Table is actually a collection of tables, for four alpha levels: .10. .5, .025 and .01. The three f tables you can find on this site are for alpha levels of .10, .0 and .01. When using the F dist. table, always put the numerator degrees of freedom first; if you switch the numerator and denominator around, you’ll get a different result. The table gives you the area in the right tail. Instead of a table, you can use a calculator — which will give you more accurate results. 
What is the F Statistic Table Used for?
When you have found the F value, you can compare it with an f critical value in the table. If your observed value of F is larger than the value in the F table, then you can reject the null hypothesis with 95 percent confidence that the variance between your two populations isn’t due to random chance.
How to use the F Statistic Table
The F Statistic Table is actually a collection of tables. Which specific table you use will depend on which alpha level you use. For example, if you have an alpha level of .05, then your right tail area is .05 (5 percent), and you’ll look up the f critical value in the alpha level = .05 table. The rows in the F Distribution Table represent denominator degrees of freedom and the columns represent numerator degrees of freedom. For example, to determine the .10 f critical value for an F distribution with 6 and 6 degrees of freedom, look in the 6 column (numerator) and the 6 row (denominator) of the F Table for alpha=.10. F(.10, 6, 6) = 3.054 55.
55.
Why Use the F Statistic Table? Why not just use a calculator? A calculator will certainly give you a fast answer. But with many scenarios in statistics, you will look at a range of possibilities and a table is much better for visualizing a large number of probabilities at the same time. Back to Top
References
- Guide to Microsoft Excel for calculations, statistics, and plotting data
- Using the F-test to Compare Two Models. Retrieved August 17, 2021 from: https://sites.duke.edu/bossbackup/files/2013/02/FTestTutorial.pdf
- Archdeacon, T. (1994). Correlation and Regression Analysis: A Historian’s Guide. Univ of Wisconsin Press.
- If the larger variance is placed in the denominator, then a large F-statistic will mean that the variance between groups is much larger than the variance within groups. This means you can reject the null hypothesis, regardless of whether the F-statistic is large in the upper tail or the lower tail of the distribution.
- If the smaller variance is placed in the denominator, then a large F-statistic could mean that the variance between groups is larger than the variance within groups. It could also mean that the variance within groups is smaller than the variance between groups. In this case, we would need to consult both the upper and lower critical values to determine whether to reject the null hypothesis.
The F Statistic and P Value
The F statistic must be used in combination with the p value when you are deciding if your overall results are significant. Why? If you have a significant result, it doesn’t mean that all your variables are significant. The statistic is just comparing the joint effect of all the variables together. For example, if you are using the F Statistic in regression analysis (perhaps for a change in R Squared, the Coefficient of Determination), you would use the p value to get the “big picture.”
- If the p value is less than the alpha level, go to Step 2 (otherwise your results are not significant and you cannot reject the null hypothesis). A common alpha level for tests is 0.05.
- Study the individual p values to find out which of the individual variables are statistically significant.
The F Value in ANOVA
The F value in one way ANOVA is a tool to help you answer the question “Is the variance between the means of two populations significantly different?” The F value in the ANOVA test also determines the P value; The P value is the probability of getting a result at least as extreme as the one that was actually observed, given that the null hypothesis is true. The p value is a probability, while the f ratio is a test statistic, calculated as:
F value = variance of the group means (Mean Square Between) / mean of the within group variances (Mean Squared Error)
When Do I Reject the Null Hypothesis?
Reject the null when your p value is smaller than your alpha level. You should not reject the null if your critical f value is smaller than your F Value, unless you also have a small p-value. Where this could get confusing is where one of these values seems to indicate that you should reject the null hypothesis and one of the values indicates you should not. For example, let’s say your One Way ANOVA has a p value of 0.68 and an alpha level of 0.05. As the p value is large, you should not reject the null hypothesis. However, your f value is 4.0 with an f critical value of 3.2. Should you now reject the null hypothesis? The answer is NO. Why? The F value should always be used along with the p value in deciding whether your results are significant enough to reject the null hypothesis. If you get a large f value (one that is bigger than the F critical value found in a table), it means something is significant, while a small p value means all your results are significant. The F statistic just compares the joint effect of all the variables together. To put it simply, reject the null hypothesis only if your alpha level is larger than your p value. Caution: If you are running an F Test in Excel, make sure your variance 1 is smaller than variance 2. This “quirk” can give you an incorrect f ratio if you put the variances in the wrong place. See the bottom of this article for an example: F Test Two Sample Variances in Excel. 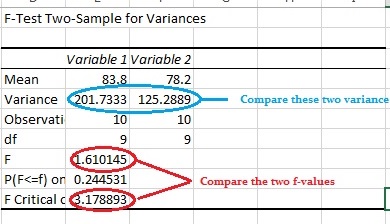 Back to Top
F Value in Regression
The F value in regression is the result of a test where the null hypothesis is that all of the regression coefficients are equal to zero. In other words, the model has no predictive capability. Basically, the f-test compares your model with zero predictor variables (the intercept only model), and decides whether your added coefficients improved the model. If you get a significant result, then whatever coefficients you included in your model improved the model’s fit. Read your p-value first. If the p-value is small (less than your alpha level), you can reject the null hypothesis. Only then should you consider the f-value. If you don’t reject the null, ignore the f-value. You must use the F statistic in combination with a p-value when deciding if your results are significant:
- Reject the null hypothesis if the p-value is smaller than the significance level.
- Do not reject the null hypothesis if your critical f value is smaller than your F statistic, unless you also have a small p-value.
It can become confusing when one value suggests rejecting the null hypothesis while another value suggests otherwise. For instance, let’s say an ANOVA has a p-value of 0.62 and an alpha level of 0.05. Since the p-value is high, you should not reject the null hypothesis. However, your f statistic is 4.0, exceeding the f critical value of 3.2. Does this mean you should reject the null hypothesis? The answer is no — because of the large p-value. Many authors recommend ignoring the P values for individual regression coefficients if the overall F ratio is not statistically significant. This is because of the multiple testing problem. In other words, your p-value and f-value should both be statistically significant in order to correctly interpret the results. If you want to know whether your regression F-value is significant, you’ll need to find the critical value in the f-table. For example, let’s say you had 3 regression degrees of freedom (df1) and 120 residual degrees of freedom (df2). An F statistic of at least 3.95 is needed to reject the null hypothesis at an alpha level of 0.1. At this level, you stand a 1% chance of being wrong [3]. For more details on how to do this, see: F Test. F Values will range from 0 to an arbitrarily large number. Back to Top
F Distribution
The F Distribution (also called Snedecor’s F, Fisher’s F or Fisher–Snedecor distribution) is a probability distribution of the F Statistic. In other words, it’s a distribution of all possible values of the F statistic. The distribution is important to understand when dealing with ANOVA (Analysis of Variance) tests, as it helps researchers test whether samples have the same variance and decide whether or not their results are statistically significant.
The distribution is an asymmetric distribution usually used for ANOVA . It has a minimum value of zero; there is no maximum value. The distribution’s peak happens just to the right of zero and the higher the f-value after that point, the lower the curve. The F distribution is actually a collection of distribution curves. The F distribution is related to chi-square, because the f distribution is the ratio of two chi-square distributions with degrees of freedom ν1 and ν2 (note: each chi-square is first been divided by its degrees of freedom). Each curve depends on the degrees of freedom in the numerator (dfn) and the denominator (dfd). These depend upon your sample characteristics. For example, in a simple one-way ANOVA between-groups,
- Dfn = a – 1
- dfd = N – a
where:
- a = the number of groups
- n = the total number of subjects in the experiment
The degrees of freedom in the denominator (dfd) is also referred to as the degrees of freedom error (dfe).
Usefulness in ANOVA
In order for the F-distribution to be useful in ANOVA testing, one must first understand what an “f-statistic” is. An f-statistic measures how much variation within each group versus how much variation between groups exists in a set of data being analyzed. In other words, if two groups have very similar scores on average but also have large variations within each group, then that would indicate that there isn’t much difference between them and thus no significant statistical difference can be determined from those results. On the other hand, if two groups have vastly different scores on average but small variations within each group, then that would indicate that there may be some kind of significant statistical difference between them and thus further investigation should be done to determine exactly what that difference might be. In order for researchers to determine whether or not their results are statistically significant based on their data analysis findings, they use an “F-test” which calculates an “F-Statistic” from their data set using specific formulas and then compares this number to an “F Distribution” which contains all possible values for an F statistic under various conditions (i.e., different numbers of groups being compared). If their calculated f statistic falls outside of this range then they can conclude that there is a statistically significant difference between their groups and further investigation should be done in order to determine why this might be happening (i.e., what caused these differences). This type of analysis helps researchers better understand their data by providing them with valuable insights they may not have seen before just by looking at raw numbers or charts alone. Back to Top
F Distribution Properties
The F distribution is the distribution of where S1 and S2 are independent random variables with chi-squared distributions and d1, d2 are their respective degrees of freedom. The probability density function (PDF) is given by where Β is the beta function. The cumulative distribution function (CDF) is Where I is the regularized incomplete beta function. Values for the F distribution can be found in F-tables. However, most statistical software will calculate the values for you during hypothesis testing. The F Distribution is also called the Snedecor’s F, Fisher’s F or the Fisher–Snedecor distribution.
F Distribution on the TI 89: Overview
There are two types of main problem you’ll encounter with the F-Distribution you might be asked to find the area under a F curve given numerator degrees of freedom (ndf), denominator degrees of freedom (ddf), and a certain range (for example, P( 1 ≤ X ≤ 2 ), or you might be asked to find the F value with area to the left, a certain ndf and ddf (useful for finding critical values for hypotheses tests).
F Distribution on TI 89: Steps
Example problem: find the area under a F curve with numerator degrees of freedom (ndf) 4 and denominator degrees of freedom (ddf) 10 for For, P( 1≤ X ≤ 2 ):
- Press APPS.
- Press ENTER twice to get to the list entry screen.
- Press F5 for “F5-Distr.”
- Scroll down to “A:F Cdf” and press ENTER.
- Enter 1 in the box for “Lower Value,” then press the down arrow key.
- Enter 2 in the box for “Upper Value,” then press the down arrow key.
- Enter 4 in the “Num df” box, then press the down arrow key.
- Enter 5 in the “Den df” box.
- Press ENTER. The calculator will return .281 as the answer.
Example problem: to find the F value with area to the left, with ndf = 5, ddf = 8, and an area of .99:
- Press APPS.
- Press ENTER twice to get to the list entry screen.
- Press F5 for “F5-Distr.”
- Press 2 for “Inverse.”
- Press 4 for “Inverse F…,” then press ENTER.
- Enter .99 in the “Area” box, then press the down arrow key.
- Enter 5 in the “Num df,” box, then press the down arrow key.
- Enter 8 in the “Den df.” box, then press ENTER. This returns the answer (63183).
Tip: For P( X ≥ 1 ), enter 1 in the box for Lower Value and 10 ^ 99 in the box for Upper Value, and for For P( X ≤ 1 ), enter 0 in the box for Lower Value, then enter 1 in the box for Upper Value. Lost your guidebook? You can download one from the TI website here.
The F Statistic Table
The F Table is a collection of tables that give you the probability for a certain alpha level. The F Table is actually a collection of tables, for four alpha levels: .10. .5, .025 and .01. The three f tables you can find on this site are for alpha levels of .10, .0 and .01. When using the F dist. table, always put the numerator degrees of freedom first; if you switch the numerator and denominator around, you’ll get a different result. The table gives you the area in the right tail. Instead of a table, you can use a calculator — which will give you more accurate results.
What is the F Statistic Table Used for?
When you have found the F value, you can compare it with an f critical value in the table. If your observed value of F is larger than the value in the F table, then you can reject the null hypothesis with 95 percent confidence that the variance between your two populations isn’t due to random chance.
How to use the F Statistic Table
The F Statistic Table is actually a collection of tables. Which specific table you use will depend on which alpha level you use. For example, if you have an alpha level of .05, then your right tail area is .05 (5 percent), and you’ll look up the f critical value in the alpha level = .05 table. The rows in the F Distribution Table represent denominator degrees of freedom and the columns represent numerator degrees of freedom. For example, to determine the .10 f critical value for an F distribution with 6 and 6 degrees of freedom, look in the 6 column (numerator) and the 6 row (denominator) of the F Table for alpha=.10. F(.10, 6, 6) = 3.05455.
Why Use the F Statistic Table? Why not just use a calculator? A calculator will certainly give you a fast answer. But with many scenarios in statistics, you will look at a range of possibilities and a table is much better for visualizing a large number of probabilities at the same time. Back to Top
References
- Guide to Microsoft Excel for calculations, statistics, and plotting data
- Using the F-test to Compare Two Models. Retrieved August 17, 2021 from: https://sites.duke.edu/bossbackup/files/2013/02/FTestTutorial.pdf
- Archdeacon, T. (1994). Correlation and Regression Analysis: A Historian’s Guide. Univ of Wisconsin Press.