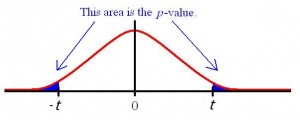
Contents:
- What is an Independent Samples T Test?
- Assumptions for the Independent Samples T Test
- How to Run an Independent Samples T Test (Excel/SPSS)
- How to Calculate an Independent Samples T Test by Hand
What is an Independent Samples T Test?
The independent samples t test (also called the unpaired samples t test) is the most common form of the T test. It helps you to compare the means of two sets of data. For example, you could run a t test to see if the average test scores of males and females are different; the test answers the question, “Could these differences have occurred by random chance?” The two other types of t test are:
- One sample t test: used to compare a result to an expected value. For example, do males score higher than the average of 70 on a test if their exam time is switched to 8 a.m.?
- Paired t test (dependent samples): used to compare related observations. For example, do test scores differ significantly if the test is taken at 8 a.m. or noon?
This test is extremely useful because for the z test you need to know facts about the population, like the population standard deviation. With the independent samples t test, you don’t need to know this information. You should use this test when:
- You do not know the population mean or standard deviation.
- You have two independent, separate samples.
Assumptions for the Independent Samples T Test
- Assumption of Independence: you need two independent, categorical groups that represent your independent variable. In the above example of test scores “males” or “females” would be your independent variable.
- Assumption of normality: the dependent variable should be approximately normally distributed. The dependent variable should also be measured on a continuous scale. In the above example on average test scores, the “test score” would be the dependent variable.
- Assumption of Homogeneity of Variance: The variances of the dependent variable should be equal.
How to Run an Independent Samples T Test
Technology is usually used to run this test. For Excel instructions, see: How to run a T Test in Excel. For instructions by hand, scroll down.
Back to top
How to Run an Independent Samples T Test in SPSS
Before you perform a t test in SPSS for independent samples, you should:
- Write a hypothesis statement. For the above research question, the null hypothesis would be that there is no significant difference
- Determine if your test is one-tailed or two-tailed
- Specify an alpha level.
Watch the video for the steps:
Step 1: Open the worksheet with the data you want to perform the t test in SPSS.
Step 2: Define the SPSS variables you want to perform a t-test on. For example, you might want to compare GPAs between male and female high school students. Therefore, you’ll want to define the variables “sex” (i.e. other male or female). If you aren’t sure how to define variables in SPSS, click here to find out how.
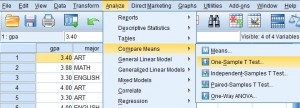
Step 3: Click “Analyze,” then click “Compare Means,” then click “Independent Sample T Test.”
Step 4: Select the dependent variable from the left window pane and then click the top arrow button to move the variables over to the Test Variable(s): window. For this example, we are comparing GPAs, so the test variable we want to select is GPA.
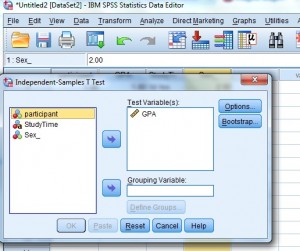
Step 5: Select the independent variable in the left window and then click the arrow to the left of the “Grouping Variable” box. The grouping variable is the variable you divided into groups when you defined variables. For this example, the groups are “male” and “female” so the grouping variable you want to select is “Sex.”
Step 6: Click “Define Groups.” For this example, type “1” into the Group 1 box (for female) and then type “2” into the Group 2 box (for male).
Step 7: Click “Continue” and then click “OK.” The test is calculated and the results will appear in a new window.
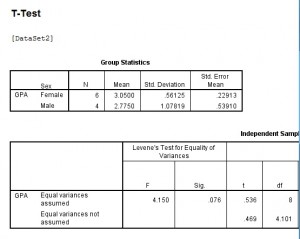
T Test in SPSS: Output
Your output will include:
- The Levine’s test for equal variance (the first section of the Independent Samples Test box). If the significance level is larger than .05, you should use the first line in the output table, Equal variances assumed. If the value is .05 or lower, use the second row of results.
- Sig (2 Tailed): use the value indicated in Levine’s test. If this p-value is above .05, then there is not a significant difference in test scores.
Tip: Click “Options” on the t-test window to change the confidence interval.
Check out our YouTube Channel for more SPSS videos!
Back to top
Calculating an Independent Samples T Test By hand
Sample question: Calculate an independent samples t test for the following data sets:
Data set A: 1,2,2,3,3,4,4,5,5,6
Data set B: 1,2,4,5,5,5,6,6,7,9
Step 1: Sum the two groups:
A: 1 + 2 + 2 + 3 + 3 + 4 + 4 + 5 + 5 + 6 = 35
B: 1 + 2 + 4 + 5 + 5 + 5 + 6 + 6 + 7 + 9 = 50
Step 2: Square the sums from Step 1:
352 = 1225
492 = 2500
Set these numbers aside for a moment.
Step 3: Calculate the means for the two groups:
A: (1 + 2 + 2 + 3 + 3 + 4 + 4 + 5 + 5 + 6)/10 = 35/10 = 3.5
B: (1 + 2 + 4 + 5 + 5 + 5 + 6 + 6 + 7 + 9) = 50/10 = 5
Set these numbers aside for a moment.
Step 4: Square the individual scores and then add them up:
A: 11 + 22 + 22 + 33 + 33 + 44 + 44 + 55 + 55 + 66 = 145
B: 12 + 22 + 44 + 55 + 55 + 55 + 66 + 66 + 77 + 99 = 298
Set these numbers aside for a moment.
Step 5: Insert your numbers into the following formula and solve:

(ΣA)2: Sum of data set A, squared (Step 2).
(ΣB)2: Sum of data set B, squared (Step 2).
μA: Mean of data set A (Step 3)
μB: Mean of data set B (Step 3)
ΣA2: Sum of the squares of data set A (Step 4)
ΣB2: Sum of the squares of data set B (Step 4)
nA: Number of items in data set A
nB: Number of items in data set B
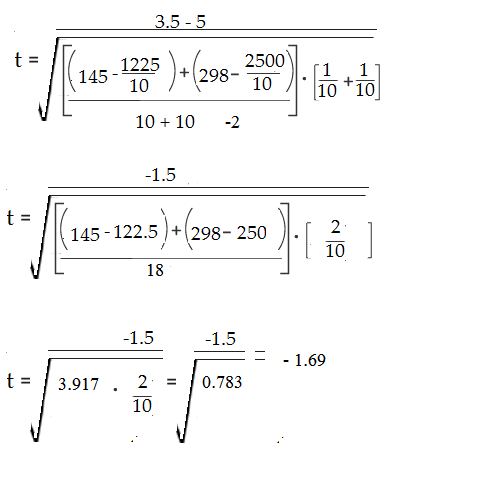
Step 6: Find the Degrees of freedom (nA-1 + nB-1) = 18
Step 7: Look up your degrees of freedom (Step 6) in the t-table. If you don’t know what your alpha level is, use 5% (0.05).
18 degrees of freedom at an alpha level of 0.05 = 2.10.
Step 8: Compare your calculated value (Step 5) to your table value (Step 7). The calculated value of -1.79 is less than the cutoff of 2.10 from the table. Therefore p > .05. As the p-value is greater than the alpha level, we cannot conclude that there is a difference between means.
References
Everitt, B. S.; Skrondal, A. (2010), The Cambridge Dictionary of Statistics, Cambridge University Press.
Gonick, L. (1993). The Cartoon Guide to Statistics. HarperPerennial.
Levine, D. (2014). Even You Can Learn Statistics and Analytics: An Easy to Understand Guide to Statistics and Analytics 3rd Edition. Pearson FT Press
Salkind, N. (2016). Statistics for People Who (Think They) Hate Statistics: Using Microsoft Excel 4th Edition.