Statistics Definitions > Assumption of Normality / Normality Test
What is Assumption of Normality?
Assumption of normality means that you should make sure your data roughly fits a bell curve shape before running certain statistical tests or regression. The tests that require normally distributed data include:
How to Test for Normality
You’ve got two main ways to test for normality: eyeball a graph, or run a test that’s specifically designed to test for normality. The data doesn’t have to be perfectly normal. However, data that definitely does not meet the assumption of normality is going to give you poor results for certain types of test (i.e. ones that state that the assumption must be met!). How closely does your data have to meet the test for normality? This is a judgment call.
If you’re uncomfortable with making that judgement (which is usually based on experience with statistics), then you may be better off running a statistical test (scroll down for the test options). That said, some of the tests can be cumbersome to use and involve finding test statistics and critical values.
Stuck on which option to choose? If you’re new to statistics, the easiest graph to decipher is the histogram. The easiest test to run is probably the Jarque-Bera Test.
Using a Graph for a Normality Test.
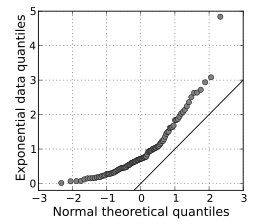
A Q Q plot compares two different distributions. If the two sets of data came from the same distribution, the points will fall on a 45 degree reference line. To use this type of graph for the assumption of normality, compare your data to data from a distribution with known normality.
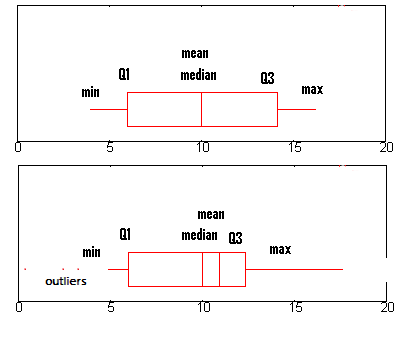
Boxplots for normally distributed data (top) and non-normal data (bottom).
Draw a boxplot of your data. If your data comes from a normal distribution, the box will be symmetrical with the mean and median in the center. If the data meets the assumption of normality, there should also be few outliers.

The normal probability plot was designed specifically to test for the assumption of normality. If your data comes from a normal distribution, the points on the graph will form a line.
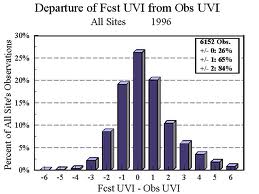
The popular histogram can give you a good idea about whether your data meets the assumption. If your data looks like a bell curve: then it’s probably normal.
Statistical Tests for Normality
You’ve got lots of options to test for normality. Most of these are included with statistical packages like SPSS.
- Chi-square normality test. You can use a chi square test for normality. The advantage is that it’s relatively easy to use, but it isn’t a very strong test. If you have a small sample (under 20), it may be the only test you can use. For larger samples, you’re much better off choosing another option.
- D’Agostino-Pearson Test. This uses skewness and kurtosis to see if your data matches normal data. It requires your sample size to be over 20.
- Jarque-Bera Test. This common test is also relatively straightforward. Like the D’Agostino-Pearson, the basic idea is that it tests the skew and kurtosis of your data to see if it matches what you would expect from a normal distribution. The larger the JB statistic, the more the data deviates from the normal.
- Kolmogorov-Smirnov Goodness of Fit Test. This compares your data with a known distribution (i.e. a normal distribution).
- Lilliefors Test. The Lilliefors test calculates a test statistic T which you can compare to a critical value. If the test statistic is bigger than the critical value, it’s a sign that your data isn’t normal. It also computes a p-value for your distribution, which you compare to a significance level.
- Shapiro-Wilk Test This test will tell you if a random sample came from a normal distribution. The test gives you a W value; small values indicate your sample is not normally distributed.
References
Klein, G. (2013). The Cartoon Introduction to Statistics. Hill & Wamg.
Kotz, S.; et al., eds. (2006), Encyclopedia of Statistical Sciences, Wiley.
Vogt, W.P. (2005). Dictionary of Statistics & Methodology: A Nontechnical Guide for the Social Sciences. SAGE.
Wheelan, C. (2014). Naked Statistics. W. W. Norton & Company