Statistics Definitions > Average (Mean) Deviation
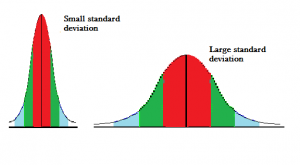
In statistics, the standard deviation is the usual way of measuring distance from the mean or median (technically it measures dispersion or variance, which is a complicated way of saying distance).
Absolute Deviations and Average Deviations
In order to understand what the average deviation is, you should understand what the term absolute deviation is. Absolute deviation is the distance between each value in the data set and that data set’s mean or median. To find the distance:
- Subtract the values. For example, let’s say the mean of your data set is 10, and you have 5 values: 1, 5, 10, 15 and 19. The absolute deviations are:
- 10 – 1 = 9
- 10 – 5 = 5
- 10 – 10 = 0
- 10 – 15 = -5
- 10 – 19 = -9
- Take the absolute value of the numbers found. The absolute value of -5 is 5, and -9 is 9. The final list of values would be 9 ,5, 0, 5, and 9.
Take all of these absolute deviations, find the average, and you have the mean average deviation.
How to Calculate Average Deviation
The following steps show how to calculate average deviation for the mean. If you want to calculate average deviation for the median, just replace any value for the mean with the value for the median.
The absolute deviation formula (i.e. the formula to calculate the distance for one point) is:
Absolute deviation = |x – x̄|
Which leads to the average deviation formula:
Dx = (|x1 – x̄| + |x2 – x̄| +…+ |x3 – x̄|) / N
While simple, the formula creates problems for us down the line, similar to how an absolute value inside a function can cause problems with differentiation. In addition, the sample MAD is a biased estimator for the population MAD. In other words, it’s average value doesn’t match the populations MAD (Emory, 2021).
Example question: Find the average deviation of the following set of numbers: 3, 8, 8, 8, 8, 9, 9, 9, 9.
Step 1: Find the mean:
(3 + 8 + 8 + 8 + 8 + 9 + 9 + 9 + 9) = 71.9 = 7.89.
Step 2: Find each individual absolute deviation using the formula |x – x̄|.
- |3 – 7.89| = 4.89
- |8 – 7.89| = 0.11
- |8 – 7.89| = 0.11
- |8 – 7.89| = 0.11
- |8 – 7.89| = 0.11
- |9 – 7.89| = 1.11
- |9 – 7.89| = 1.11
- |9 – 7.89| = 1.11
- |9 – 7.89| = 1.11
Step 3: Add up all of the values you found in Step 1.
4.89+0.11+0.11+0.11+0.11+1.11+1.11+1.11+1.11= 9.77
Step 4: Divide by the number of items in your data set. There are 9 items, so:
9.77/9 = 1.09.
The average deviation is 1.09.
Standard Deviation vs. Average Deviation
Absolute Deviation is used less frequently than the standard deviation, but it’s extremely similar: both are a measure of spread. There are occasions when two different sets of data with different spreads can produce the exact same absolute deviation. However, the standard deviation can also be the same for different data sets. The absolute deviation is also considered to be more accurate for real-life situations; some authors have suggested that MAD should replace the standard deviation for real-life data. As well as potentially being more accurate, it’s also a lot simpler to calculate.
Check out our YouTube channel for hundreds of basic stats videos!
References
Beyer, W. H. CRC Standard Mathematical Tables, 31st ed. Boca Raton, FL: CRC Press, pp. 536 and 571, 2002.
Agresti A. (1990) Categorical Data Analysis. John Wiley and Sons, New York.
Emory, Oxford College (2021). http://mathcenter.oxford.emory.edu/site/math117/shapeCenterAndSpread/
Klein, G. (2013). The Cartoon Introduction to Statistics. Hill & Wamg.
Vogt, W.P. (2005). Dictionary of Statistics & Methodology: A Nontechnical Guide for the Social Sciences. SAGE.
