< < Part One: Skewed Distribution
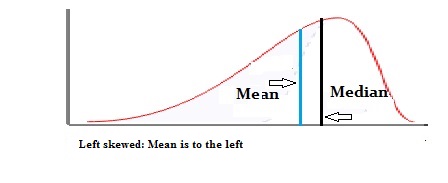
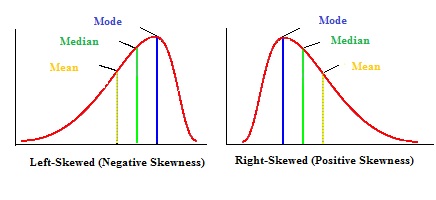
In the first part of this article, we covered the basics for left-skewed and right-skewed distributions. You also learned how the mean and median are affected by skewness. This second part delves into the mathematics for various types of distributions you’re likely to see in elementary stats.
Contents:
What is Skewness?
Skewness is a measure of symmetry in a distribution. Actually, it’s more correct to describe it as a measure of lack of symmetry. A standard normal distribution is perfectly symmetrical and has zero skew. Other examples of zero-skewed distributions are the T Distribution, the uniform distribution and the Laplace distribution. However, other distributions don’t have zero skew. Therefore, we need a way to calculate how much the distribution is skewed.
Equations
The following table shows the equations for calculating the skew for various distributions you’re likely to come across in elementary statistics. Note that the normal, Student’s T, uniform and Laplace distributions are not shown on the table as they are not skewed.
| Distribution. | Equation. |
|---|---|
| Bernoulli distribution. | |
| Beta distribution. | |
| Binomial distribution. | |
| Chi square distribution. | |
| F distribution. | |
| Negative binomial. | |
| Poisson Distribution. |
Calculation
The formula given in most textbooks is Skew = 3 * (Mean – Median) / Standard Deviation. This is known as an alternative Pearson Mode Skewness.
You could calculate skew by hand. But why bother? Most stats software can calculate it for you.
Skewness in Excel 2013: “=SKEW(xx:yy)” where xx:yy is the cell location of your data (for example, C1:C25).
Skewness in Minitab:
- Click “Stat”, then click “Basic Statistics,” then click “Descriptive Statistics.”
- Click the variables you want to find the median for and then click “Select” to move the variable names to the right window.
- Click “Statistics.”
- Check the “Skewness” box and then click “OK” twice.
Excel, Minitab and most other modern software packages use the adjusted Fisher-Pearson standardized moment coefficient to find skew.
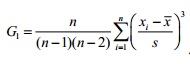
You probably won’t actually see or use this formula; It generally doesn’t even appear in elementary stats textbooks. But it is the one used behind the scenes by most software. The results of the calculation tell you:
- The direction of the skew (positive or negative).
- How the sample compares with a normal (symmetric) distribution. The further the skew result is from zero, the greater the skew.
Different Ways to Measure a Skew:
What is Momental Skewness?
Momental skewness is one of four ways you can calculate the skew of a distribution. It’s called “Momental” because the first moment in statistics is the mean.
The formula for calculating momental skewness (γ) is:
α(m) = 1/2 γ1 = μ3 / 2 σ3
Where μ is the mean and σ is the standard deviation and γ is the Fisher Skewness.
Why use Momental Skewness?
Which technique you use depends on what you know about your data. For example, if you know the mean, mode (or median) and standard deviation you can use Pearson’s. Momental skewness could be an option if you only know the mean and standard deviation for your set of data.
What do the Results Mean?
A symmetrical distribution has a skew of zero. A positive result means that your data is positively skewed. A negative results means that your data is negatively skewed. Momental skewness will give you a result that is half of typical skewness.
Skewness in Excel
Watch the video for the steps:
When you calculate skewness in Excel, Excel will return a positive or a negative number. A normal distribution, which has perfectly symmetrical tails, has a skewness of zero.
You have two different options for calculating skewness in Excel 2013: the SKEW function or Data Analysis (How to load the Data Analysis Toolpak). If you’re taking a statistics class, it would be worth your while to install the Toolpak as it gives you access to many stats functions that aren’t in the base installation of Excel.
SKEW Function
Step 1: Type your data into columns.
Step 2: Click an empty cell on the worksheet.
Step 3: Type “=SKEW(xx:yy)” where xx:yy is the cell location of your data (for example, C1:C25).
Data Analysis
Step 1: Click the “Data” tab and then click “Data Analysis.”
Step 2: Click “Descriptive Statistics” and then click “OK.”
Step 3: Click the Input Range box and then type the location for your data. For example, if you typed your data into cells A1 to A10, type “A1:A10” into that box
Step 4: Click the radio button for Rows or Columns, depending on how your data is laid out.
Step 5: Click the “Labels in first row” box if your data has column headers.
Step 6: Click the “Descriptive Statistics” check box.
Step 7: Select a location for your output. For example, click the “New Worksheet” radio button.
Step 8: Click “OK.”
Back to Top
Check out our YouTube channel for more stats help and tips!