Probability and Statistics > Regression Analysis > Assumptions and Conditions for Regression
Assumptions and Conditions for Regression.
Regression can be a very useful tool for finding patterns in data sets. However, your data can’t always be fit to a regression line. Most software, like SPSS and Excel, will always give you a the best regression line it can find even if the regression line doesn’t make sense. It’s up to you to figure out beforehand if your data makes sense for regression analysis. How do you do that? By considering the following assumptions and conditions for regression before you run the test:
- The Quantitative Data Condition.
- The Straight Enough Condition (or “linearity”).
- The Outlier Condition.
- Independence of Errors
- Homoscedasticity
- Normality of Error Distribution
The Quantitative Data Condition/ Quantitative Variables Condition.
You can only perform regression on quantitative variables. In other words, if your data isn’t a set of numbers, regression isn’t a good method for finding a trend. Check that your variables have actual units and that they are measuring something that makes sense.
In order to find out if your data meets to quantitative data condition, you have to make sure you have quantitative data (numerical data) and not qualitative data. Qualitative data is data that fits into categories (that’s why it’s also called categorical data). See: Quantitative or Qualitative: How to Classify Variables.
Categorical Variables that Masquerade as Quantitative.
 Sometimes in statistics you can assign numbers to categorical variables in order to force them to become quantitative (so you can perform computations). For example, a deck of cards is made up of quantitative variables (the numbers on the cards) and categorical variables (the suits: hearts, diamonds, spades, clubs). You can give the suits numbers in order to make them numeric:
- Hearts = 1
- Diamonds = 2
- Spades = 3
- Clubs = 4
However, giving numbers to categorical data does not turn them into quantitative variables; They are still categorical variables: just ones that have been assigned numbers. Therefore, you can’t perform regression on these types of variables because they do not meet to quantitative variables condition.
The Straight Enough Condition (Assumption of Linearity).
(Linear Regression only). Regression lines will be very misleading if your data isn’t approximately linear. The best way to check this condition is to make a scatter plot of your data. If the data looks like it can roughly fit a line, you can perform regression. For other types of regression (like exponential regression), eyeball the scatter plot to make sure it roughly follows the shape of whatever regression you are performing.
The Outlier Condition.
Outliers can have a dramatic effect on regression lines and the correlation coefficient you get when you run regression analysis. If you do have an outlier in your data, it’s a good idea to run regression analysis twice: Once with the outlier and once without.
Independence of Errors
If your points are following a clear pattern, it might indicate that the errors are influencing each other. The errors are the deviations of an observed value from the true function value. The following image shows two linear regression lines; on the left, the points are scattered randomly. On the right, the points are clearly influencing each other.
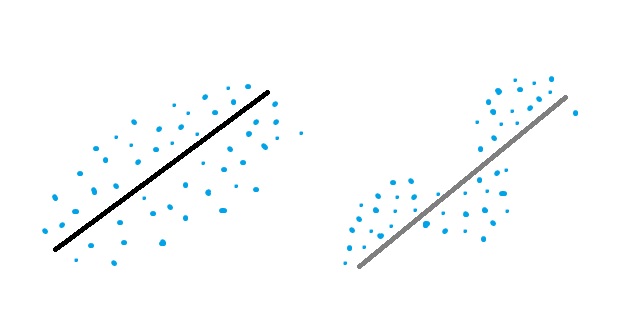
If you don’t have random errors, you can’t run linear regression as your predictions won’t be accurate.
Homoscedasticity
With homoscedasticity, you basically want your points to look like a tube instead of a cone. Heteroscedasticity is where, like independence of errors, you see a trend in the errors but this time the trend is larger or smaller (as opposed to the errors clearly influencing each other). In the picture below, the left graph shows a linear regression line where the errors are getting larger. The shape is cone-like.
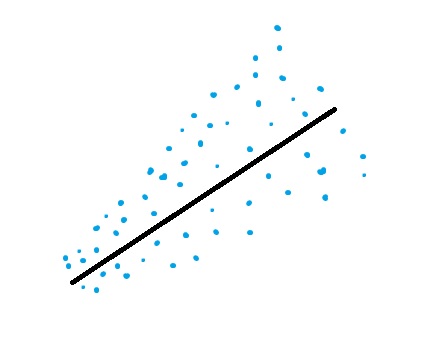
Running linear regression on data that shows heteroscedasticity will give you poor results.
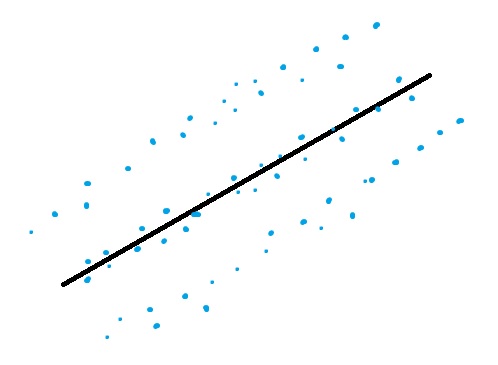
Normality of Error Distribution
At any point in your x-values, the data points should be normally distributed around the regression line. Your values should be fairly close to the line, evenly distributed with only a few outliers. The following image shows data that is fairly normally distributed on the left. The data on the right has data that is either clustered to the line or far from the line. Linear regression should not be run on values that are not normally distributed.