What is statistical power?
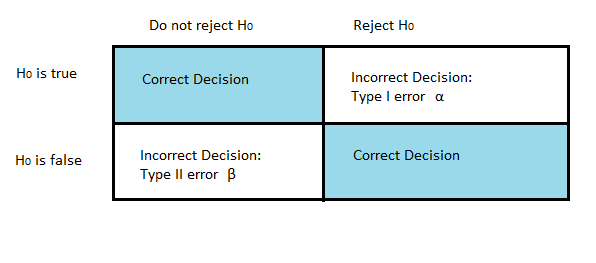
Statistical power, also called sensitivity, indicates the probability that a study can distinguish an actual effect from a chance occurrence. It represents the probability that a test correctly rejects the null hypothesis (i.e., it represents the probability of avoiding a Type I error).
The probability of not rejecting a false null hypothesis is represented by Beta (β), and statistical power is the complement of this probability, i.e., 1- β. Watch the video below for an overview on statistical power:

Can’t see the video? Click here to watch it on YouTube.
The meaning of high and low statistical power
High statistical power suggests that the test results are likely trustworthy. On the flip side, low statistical power casts doubt on the reliability of the test results.
Generally speaking, a power of over .80 is considered high enough [1] and is the bar set by the NIH for grant funding [2]; A power of .80 means that there is an 80% probability of rejecting the null hypothesis when it is false. However, some studies — especially in the medical sciences — may require power of .90 or more. As power increases, the probability of making a Type II error (i.e., failing to reject a false null hypothesis) decreases.
There are a few ways to increase power, including:
- A larger sample size will lead to a higher statistical power. This is because a larger sample size provides more information about the population, which will make it easier to detect an effect. Statistical power can also aid in assessing whether a sample size is large enough: if the statistical power is low, it might indicate a need to increase a sample size.
- A larger effect size will also lead to a higher statistical power. This is because a larger effect size is easier to detect than a smaller effect size.
- A lower significance level will lead to a lower statistical power. This is because a lower significance level means that we are less likely to reject the null hypothesis when it is false, which means that we are more likely to make a Type II error.
Therefore, to achieve high statistical power, a “large enough” sample size and a large effect size are necessary.
While it’s feasible to conduct a hypothesis test without calculating the statistical power, doing so may result in inconclusive or untrustworthy results.
Statistical Power and Beta
. Beta( β) is the probability that you won’t reject the null hypothesis when it is false. The statistical power is the complement of this probability: 1- Β.
How to Calculate Statistical Power
Statistical Power is quite complex to calculate by hand. This article on MoreSteam explains it well. Therefore, software is normally used to calculate the power.
Power analysis
A power analysis is a calculation that helps determine the smallest sample size required for your study.
This analysis consists of four main elements. If you have knowledge or estimates of any three, you can calculate the fourth element.
- Statistical power.
- Sample size: the fewest number of observations required to spot an effect of a certain magnitude with a given power level.
- Significance level (alpha): this is the maximum risk you’re willing to accept of incorrectly rejecting a true null hypothesis, often set at 5%.
- Expected effect size: this represents the expected result’s magnitude in a standardized way, often based on similar studies or a pilot study.
Conventionally, the significance level is set at 5%, and the power is set at 80%. This means that you only need to determine an expected effect size to calculate a sample size from a power analysis.
While power analysis can help you find the “right” sample size, it can be conducted for several other reasons, including determining the number of trials required to detect a certain effect size, finding the power given an effect size and available trials (useful when resources are limited), and validating your research.
Power calculation is typically complex and is usually performed on a computer. For example, the following table shows varying power calculations in R [3]:
| Function | Power Calculation For… |
|---|---|
| pwr.2p.test | Two proportions, equal n |
| pwr.2p2n.test | Two proportions, unequal n |
| pwr.anova.test | Balanced one way anova |
| pwr.chisq.test | Chi square test |
| pwr.f2.test | General linear model |
| pwr.p.test | Proportion, one sample |
| pwr.r.test | Correlation |
| pwr.t.test | t-tests (one sample, 2 samples, paired) |
The significance level α is set at a default 5% in R, but this can be changed.
SPSS added power analysis in 2021 (to SPSS 27).
Check out our YouTube channel for hundreds of elementary statistics and Probability videos!
The power function
While statistical power gives the probability of rejecting the null hypothesis when it isn’t true; the power function provides the probability of rejecting the null hypothesis for varying values of the population parameter.
In simple terms, the power function indicates how likely it is to identify a genuine effect, considering the sample size and the test’s power. For example , if we’re testing the hypothesis that the mean of a normal distribution equals 0, a power function can indicate the probability of rejecting the null hypothesis when the true mean equals 10.
If the power function equals 0., it suggests there’s a 90% likelihood of rejecting the null hypothesis when the true population mean is equal to 10.
The power function can guide us in selecting the most suitable statistical test for a specific problem. If detecting a small effect is the goal, a high-power test will be needed. On the other hand, if only large effects are of interest, a lower power test may be enough. The power function can also help determine the right sample size for a specific test. A larger sample size increases the test’s power. But the sample size also depends on the effect size we aim to detect.
While the power function plays an important role in power analysis, it’s not the sole tool involved. Power analysis also considers other factors like the effect size and the significance level to ascertain the required minimum sample size.
Statistical power function distribution
In the context of hypothesis testing, the power function distribution is a graphical depiction of the power function of a statistical test for varying values of the population parameter. It provides a visual representation of the test’s power for these different population parameter values and can serve as a comparative tool for the power of various tests. This is not to be confused with the power function distribution — which is often used for the analysis of income distribution data.
For example, if we are evaluating two tests for the hypothesis that the mean of a normal distribution equals 0, we could create the power function distributions of both tests for varying mean values.
If one test’s power function distribution consistently surpasses the other, it indicates the first test has more power than the second.
References
- The “80% power” lie: https://statmodeling.stat.columbia.edu/2017/12/04/80-power-lie/
- University of Texas-Houston Health Science Center Lesson 2.2 Hypothesis Testing
- Power analysis in Statistics with R