Unit Roots > AGF Test
What is the Augmented Dickey Fuller Test?
The Augmented Dickey Fuller Test (ADF) is unit root test for stationarity. Unit roots can cause unpredictable results in your time series analysis.
The Augmented Dickey-Fuller test can be used with serial correlation. The ADF test can handle more complex models than the Dickey-Fuller test, and it is also more powerful. That said, it should be used with caution because—like most unit root tests—it has a relatively high Type I error rate.
Hypotheses
The hypotheses for the test:
- The null hypothesis for this test is that there is a unit root.
- The alternate hypothesis differs slightly according to which equation you’re using. The basic alternate is that the time series is stationary (or trend-stationary).
Choosing Models and Lags
Before you run an ADF test, inspect your data to figure out an appropriate regression model. For example, a nonzero mean indicates the regression will have a constant term. The three basic regression models are:
- No constant, no trend: Δyt = γyt-1 + vt
- Constant, no trend: Δyt = α + γyt-1 + vt
- Constant and trend: Δyt = α + γyt-1 + λt + vt
The Augmented Dickey Fuller adds lagged differences to these models:
- No constant, no trend: Δyt = γyt-1 +
 asΔyt-s + vt
 - Constant, no trend: Δyt = α + γyt-1 + asΔyt-s + vt
- Constant and trend: Δyt = α + γyt-1 + λt + asΔyt-s + vt
You need to choose a lag length to run the test. The lag length should be chosen so that the residuals aren’t serially correlated. You’ve got several options for choosing lags: Minimize Akaike’s information criterion (AIC) or Bayesian information criterion (BIC), or drop lags until the last lag is statistically significant.
Using Software
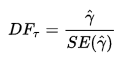
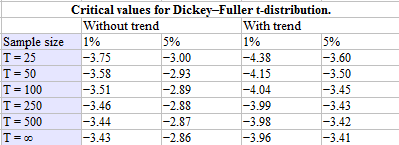
Although software will run the test, it’s usually up to you to interpret the results. In general, a p-value of less than 5% means you can reject the null hypothesis that there is a unit root. You can also compare the calculated DFT statistic with a tabulated critical value. If the DFT statistic is more negative than the table value, reject the null hypothesis of a unit root. Note: The more negative the DF test statistic, the stronger the evidence for rejecting the null hypothesis of a unit root.
The DF test statistic:
Excel:
Excel doesn’t have a built-in function for the ADF test, but you can run one on your data using the regression and t-test features in the software. The steps are not easy to do, and require a lot of formulas (it’s much easier to do in other software like R or SAS). This PDF, from Principles of Econometrics, shows the set up and formulas with clear images (pp. 181-185).
R
To run ADF in R, use the adf.test function found in the tseries package. It has many options, including:
- “c” (default): for a regression with a constant but not a time trend,
- “nc”: no intercept, no time trend,
- “ct”: intercept and time trend.
Other options in R include nsdiffs in the forecast package and adfTest in the fUnitRoots package.
Stata:
SAS:
Run an ADF test in PROC ARIMA.
References:
Fuller, W. A. (1976). Introduction to Statistical Time Series. New York: John Wiley and Sons. ISBN 0-471-28715-6.
Ogunc, A. & Hill, C. (2008) Using Excel: Companion to Principles of Econometrics, Third Edition. Retrieved January 4, 2017 from: http://econweb.tamu.edu/hwang/CLASS/Ecmt463/Lecture%20Notes/Excel/Excel_Lessons.pdf