Mean Median Mode: Contents (Click to skip to that section):
- Overview
- How to find the mean, median and mode by hand.
- Find the mean, median and mode with Technology:
Overview of Mean Median Mode
The mean median mode are measurements of central tendency. In other words, it tells you where the “middle” of a data set it. Each of these statistics defines the middle differently:
- The mean is the average of a data set.
- The mode is the most common number in a data set.
- The median is the middle of the set of numbers.
Of the three, the mean is the only one that requires a formula. I like to think of it in the other dictionary sense of the word (as in, it’s “mean” as opposed to nice!). That’s because, compared to the other two, it’s not as easy to work with because of the formula.
Hints to remember the difference between Mean Median Mode
Having trouble with the mean median mode differences? Here’s a couple of hints that can help.
- “A la mode” is a French word that means fashionable ; It also refers to a popular way of serving ice cream. So “Mode” is the most popular or fashionable member of a set of numbers. The word MOde is also like MOst.
- The “Mean” requires you do arithmetic (adding all the numbers and dividing) so that’s the “mean” one.
- “Median” has the same number of letters as “Middle”.
The Mean
Mean vs Median
Both are measures of where the center of a data set lies (called “Central Tendency” in stats), but they are usually different numbers. For example, take this list of numbers: 10, 10, 20, 40, 70.
- The mean (informally, the “average“) is found by adding all of the numbers together and dividing by the number of items in the set: 10 + 10 + 20 + 40 + 70 / 5 = 30.
- The median is found by ordering the set from lowest to highest and finding the exact middle. The median is just the middle number: 20.
Sometimes the two will be the same number. For example, the data set 1, 2, 4, 6, 7 has a mean of 1 + 2 + 4 + 6 + 7 / 5 = 4 and a median (a middle) of 4.
Mean vs Average: What’s the Difference?
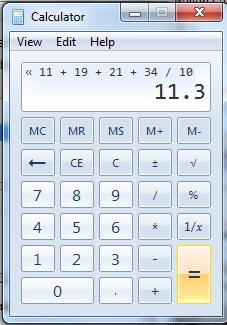
When you first started out in mathematics, you were probably taught that an average was a “middling” amount for a set of numbers. You added up the numbers, divided by the number of items you can and voila! you get the average. For example, the average of 10, 6 and 20 is:
10 + 6 + 20 = 36 / 3 = 12.
The you started studying statistics and all of a sudden the “average” is now called the mean. What happened? The answer is that they have the same meaning(they are synonyms).
However there is a caveat. Technically, the word mean is short for the arithmetic mean. We use different words in stats, because there are multiple different types of means, and they all do different things.
Specific “Means” commonly used in Stats
You’ll probably come across these in an elementary stats class. They have very narrow meanings:
- Mean of the sampling distribution: the center of a probability distribution, especially with respect to the Central Limit Theorem. It’s an average (of sorts) of a set of distributions.
- Sample mean: the average value in a sample.
- Population mean: the average value in a population.
Other Types
There are other types of means, and you’ll use them in various branches of math. However, most have very narrow applications to fields like finance or physics; if you’re in elementary statistics you probably won’t work with them.
These are some of the most common types you’ll come across.
- Weighted mean.
- Harmonic mean.
- Geometric mean.
- Arithmetic-Geometric mean.
- Root-Mean Square mean.
- Heronian mean.
- Graphic Mean
-
Weighted Mean
These are fairly common in statistics, especially when studying populations. Instead of each data point contributing equally to the final average, some data points contribute more than others. If all the weights are equal, then this will equal the arithmetic mean. There are certain circumstances when this can give incorrect information, as shown by Simpson’s Paradox.
-
Harmonic Mean
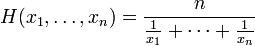
The harmonic formula.
To find it:- Add the reciprocals of the numbers in the set. To find a reciprocal, flip the fraction so that the numerator becomes the denominator and the denominator becomes the numerator. For example, the reciprocal of 6/1 is 1/6.
- Divide the answer by the number of items in the set.
- Take the reciprocal of the result.
The harmonic mean is used quite a lot in physics. In some cases involving rates and ratios it gives a better average than the arithmetic mean. In addition, you’ll also find uses in geometry, finance and computer science.
-
Geometric Mean

This type has very narrow and specific uses in finance, social sciences and technology. For example, let’s say you own stocks that earn 5% the first year, 20% the second year, and 10% the third year. If you want to know the average rate of return, you can’t use the arithmetic average. Why? Because when you are finding rates of return you are multiplying, not adding. For example, the first year at a 5% earnings rate you will multiply by 1.05. -
Arithmetic-Geometric Mean
This is used mostly in calculus and in machine computation (i.e. as the basis for many computer calculations). It’s related to the perimeter of an ellipse and when it was first developed by Gauss, it was used to calculate planetary orbits. The arithmetic-geometric is (perhaps not surprisingly) a blend of the arithmetic and geometric averages. The math is quite complicated but you can find a relatively simple explanation of the math here.
-
Root-Mean Square
It is very useful in fields that study sine waves, like electrical engineering. This particular type is also called the quadratic average. See: Quadratic Mean / Root Mean Square.
-
Heronian Mean
Used in geometry to find the volume of a pyramidal frustum. A pyramidal frustum is basically a pyramid with the tip sliced off.
-
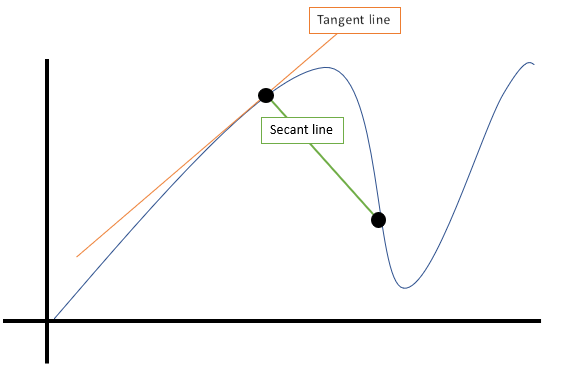
Graphic Mean
Another name for the slope of the secant line: the equivalent of the average rate of change between two points.

2. What is the Mode?
The mode is the most common number in a set. For example, the mode in this set of numbers is 21:
21, 21, 21, 23, 24, 26, 26, 28, 29, 30, 31, 33
3. What is the Median?
The median is the middle number in a data set. To find the median, list your data points in ascending order and then find the middle number. The middle number in this set is 28 as there are 4 numbers below it and 4 numbers above:
23, 24, 26, 26, 28, 29, 30, 31, 33
Note: If you have an even set of numbers, average the middle two to find the median. For example, the median of this set of numbers is 28.5 (28 + 29 / 2):
23, 24, 26, 26, 28, 29, 30, 31, 33, 34
How to find the mean median mode by hand: Steps
How to find the mean median mode: MODE
- Step 1: Put the numbers in order so that you can clearly see patterns.
For example, lets say we have 2, 19, 44, 44, 44, 51, 56, 78, 86, 99, 99. The mode is the number that appears the most often. In this case: 44, which appears three times.
How to find the mean median mode: MEAN
- Step 2: Add the numbers up to get a total.
Example: 2 +19 + 44 + 44 +44 + 51 + 56 + 78 + 86 + 99 + 99 = 622. Set this number aside for a moment. - Step 3: Count the amount of numbers in the series.
In our example (2, 19, 44, 44, 44, 51, 56, 78, 86, 99, 99), we have 11 numbers. - Step 4: Divide the number you found in step 2 by the number you found in step 3.
In our example: 622 / 11 = 56.5454545. This is the mean, sometimes called the average.
How to find the mean median mode: MEDIAN
If you had an odd number in step 3, go to step 5. If you had an even number, go to step 6.
- Step 5: Find the number in the middle of the list.
This is the median. 2, 19, 44, 44, 44, 51,56, 78, 86, 99, 99. - Step 6: Find the middle two numbers.
For example, 1, 2, 5, 6, 7, 8, 12, 15, 16, 17. The median is the number that comes in the middle of those middle two numbers (7 and 8), so that number would be 7.5 in this case. In order to do this mathematically, add the two numbers together and divide by 2.
Tip: You can have more than one mode. For example, the three modes of 1, 1, 5, 5, 6, 6 are 1, 5, and 6.
SPSS Mean mode median
In order to find the SPSS mean mode median, you’ll need to use the Frequency table. It seems a little counter-intuitive, but the Descriptive Statistics tab does not give you the option to find the mode or the median.
SPSS has a very similar interface to Microsoft Excel. Therefore, if you’ve used Microsoft Excel before, you will quickly adapt to SPSS.
SPSS Mean Median Mode: Steps
Watch the video for the steps:
Example question: Find the SPSS mean mode median for the following data set: 20,23,35,66,55,66
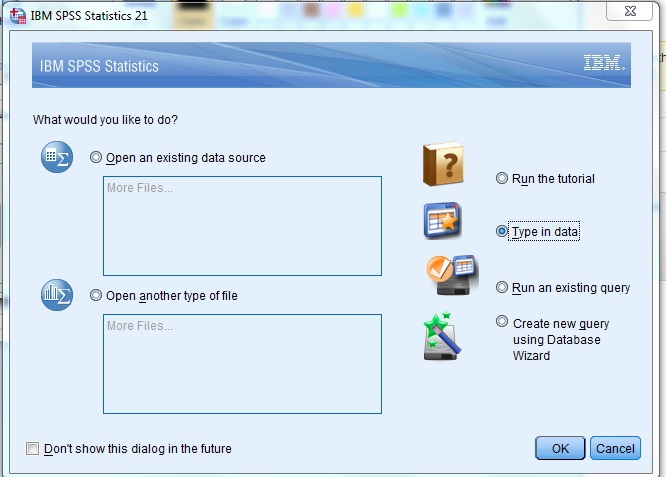
Step 1: Open SPSS. In the “What would you like to do?” dialog box, click the “type in data” radio button and then click “OK.” A new worksheet will open. Note: If you have opted out of the first help screen, you may not see this option. In that case, just start at Step 2.
Step 2: Type your data into the worksheet. You can type the data into one column or multiple columns if you have multiple data sets. For this example, type 20, 23, 35, 66, 55, 66 into column 1. Do not leave spaces between the data (i.e., don’t leave any empty rows).
Step 2: Click “Analyze,” hover over “Descriptive Statistics” and then click “Frequencies.”
Step 3: Click “Statistics” and then check the boxes “mean”, “mode” and “median.” Click “Continue” twice (select “none” as the chart type in the second window).
Note: In some versions of SPSS, you may only have to click “Continue” once and it may not give you an option for chart type.
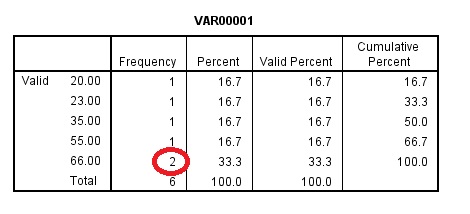
The frequency results will appear as output. The top part of the output will display the mean median mode.
If you scroll down, the frequency table will also show you the mode. The mode is defined in statistics as the number with the highest frequency (for this sample data set, the number appearing the most is 66, with two results in the frequency column).
TI 83 Mean Median Mode
Finding the TI 83 mean or TI 83 median from a list of data can be accomplished in two ways: by entering a list of data, or by using the home screen to type the commands. Using the list feature is just as easy as entering the data onto the home screen, and it has the added advantage that you can use the data for other purposes after you have calculated the mean median mode (for example, you might want to create a TI 83 histogram).
Steps for the Mean Median Mode on the TI 83
Watch the video for the mean and median on the TI 83:
Example problem: Find the mean and the median for the height of the top 20 buildings in NYC. the heights, (in feet) are: 1250, 1200, 1046, 1046, 952, 927, 915, 861, 850, 814, 813, 809, 808, 806, 792, 778, 757, 755, 752, and 750.
Step 1: Enter the above data into a list. Press the STAT button and then press ENTER. Enter the first number (1250), and then press ENTER. Continue entering numbers, pressing the ENTER button after each entry.
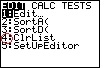
Step 2: Press the STAT button.
Step 3: Press the right arrow button to highlight “Calc.”
Step 4: Press ENTER to choose “1-Var Stats” and then type in the list name. For example, to enter L1 press [2nd] and [1].
Step 5: Press ENTER again. The calculator will return the mean, x̄. For this list of data, the TI 83 mean is 884.05 feet (rounded to 3 decimal places).
Step 6: Arrow down until you see “Med.” This is the TI 83 median; for the above data, the median is 813.05 feet.
Note: The TI-83 plus doesn’t have a built in mode function, but once you’ve entered your list, it’s pretty easy to spot the mode: it’s just the number that occurs most often in the set. Not sure? Read more about the mode here.
That’s it!
Lost your guidebook? Download a new one here at the TI website.
Find the Mean in R
Mean Median Mode References
Kenney, J. F. and Keeping, E. S. “The Mode,” “Relation Between Mean Median Mode,” and “Relative Merits of Mean Median Mode.” §4.7-4.9 in Mathematics of Statistics, Pt. 1, 3rd ed. Princeton, NJ: Van Nostrand, pp. 50-54, 1962.
Zwillinger, D. (Ed.). CRC Standard Mathematical Tables and Formulae. Boca Raton, FL: CRC Press, p. 602, 1995.