Probability Distributions > Triangular Distribution
Contents:
- The median is the value that divides the sample data into two equal halves: one of the right and one on the left.
- The mean is the average of the sample data.
You’ll want to avoid outliers because it can skew the parameter estimates. For example, one tiny outlier will result in the estimate for parameter a being too small.
The parameters can also be estimated by expert knowledge of likely values. For example, literature in your field might yield some estimated values. The mean for this distribution is: μ = 1/3 (a + b + c). The standard deviation, s, is: s = (1/√6) a. This formula makes the assumption that the distribution is centered at zero and that the endpoints are known.
Example question:
Voting for an election has close but the votes have not been counted. One candidate wants to find the probability that they received less than 450 votes. In other words, they want to find the probability p < 450. They guess that the minimum number of votes they received is 200, the maximum is 900 and the most likely scenario (the peak) is 550.
- Draw a triangular distribution with min = 200, max = 900 and peak at 550. Cut the distribution into two segments at 450 votes.
- Calculate the area of the triangle: The area of a triangle is 1/2 base * height.
- base = 450 – 200 = 250.
- height = f(450). Since 450 is between a = 200 and c = 550, this gives:
Which means the area is (base x height) = 1/2 x 250 x 0.0020408 = 0.2551 or 25.51%.
Relationship to the two-sided power distribution
The triangular distribution is a special case of the two sided power (TSP) distribution when n = 2. The probability density function (pdf) of the TSP distribution is

Where n is the shape parameter, a is the minimum and b is the maximum.
This reduces to the triangular pdf when n = 2.
Semi triangular distribution
Haight’s 1958 Index to the Distributions of Mathematical Statistics [3] lists the following formula for the semi-triangular distribution (p. 106):
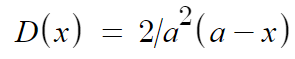
For 0 ≤ x ≤a [3].
With grouping corrections:
The formula originated from an article by Kupperman in an article titled On Exact Grouping Corrections to Moments and Cumulants (pp. 429-434). Kupperman considered the effect of grouping on the mean and variance of a new twist on the rectangular distribution that he dubbed the “semi-triangular distribution”. This new distribution has a frequency curve shaped like the right half of the “regular” triangular distribution’s frequency curve.
Kupperman [4] gave the following properties for the semi-triangular distribution:
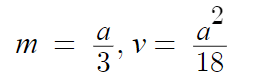
- Mean = (1/3) a
- Variance = (1/18)a2.
- Second moment about the origin = (1/6) a2.
Following Kupperman’s publication in Biometrika, the distribution makes a few sparse entries in the literature afterwards. Entries tend to be of a bibliographical nature rather than a discussion of the formula or properties. For example, Kupperman’s article is mentioned in another publication by the National Bureau of Standards in 1970 [5].
Kupperman noted that grouping the range into a number of equal intervals “overstates the mean and understates the variance”, which may be one reason why the distribution never took off in a practical sense. Another reason may be that the “full” triangular distribution, from which the semi-triangular distribution was developed, has limited practical use—it is usually used when little information is known about outcomes except the most likely one (this creates the peak in the center of the distribution).
References
- Image: PAR~commonswiki . CC 3.0.
- Triangular, gamma, Erlang, Weibull distributions
- Haight, F. (1958). Index to the Distributions of Mathematical Statistics. National Bureau of Standards Report.
- Kupperman, M. On Exact Grouping Corrections to Moments and Cumulants. Biometrika 39, (pp. 429-434).
- National Bureau of Standards. An Author and Permuted Title Index to Selected Statistical Journals (1970). Special Publication 321. Online: https://books.google.com/books?id=uyIBpRKalmsC
- The mode is the value that appears most often in the sample data. This is often a “best guess.” With samples, it is necessary to use a histogram to estimate the mode of the underlying PDF, which can be tricky [1].
- The median is the value that divides the sample data into two equal halves: one of the right and one on the left.
- The mean is the average of the sample data.
You’ll want to avoid outliers because it can skew the parameter estimates. For example, one tiny outlier will result in the estimate for parameter a being too small.
The parameters can also be estimated by expert knowledge of likely values. For example, literature in your field might yield some estimated values. The mean for this distribution is: μ = 1/3 (a + b + c). The standard deviation, s, is: s = (1/√6) a. This formula makes the assumption that the distribution is centered at zero and that the endpoints are known.
Example question:
Voting for an election has close but the votes have not been counted. One candidate wants to find the probability that they received less than 450 votes. In other words, they want to find the probability p < 450. They guess that the minimum number of votes they received is 200, the maximum is 900 and the most likely scenario (the peak) is 550.
- Draw a triangular distribution with min = 200, max = 900 and peak at 550. Cut the distribution into two segments at 450 votes.
- Calculate the area of the triangle: The area of a triangle is 1/2 base * height.
- base = 450 – 200 = 250.
- height = f(450). Since 450 is between a = 200 and c = 550, this gives:
Which means the area is (base x height) = 1/2 x 250 x 0.0020408 = 0.2551 or 25.51%.
Relationship to the two-sided power distribution
The triangular distribution is a special case of the two sided power (TSP) distribution when n = 2. The probability density function (pdf) of the TSP distribution is
Where n is the shape parameter, a is the minimum and b is the maximum.
This reduces to the triangular pdf when n = 2.
Semi triangular distribution
Haight’s 1958 Index to the Distributions of Mathematical Statistics [3] lists the following formula for the semi-triangular distribution (p. 106):
For 0 ≤ x ≤a [3].
With grouping corrections:
The formula originated from an article by Kupperman in an article titled On Exact Grouping Corrections to Moments and Cumulants (pp. 429-434). Kupperman considered the effect of grouping on the mean and variance of a new twist on the rectangular distribution that he dubbed the “semi-triangular distribution”. This new distribution has a frequency curve shaped like the right half of the “regular” triangular distribution’s frequency curve.
Kupperman [4] gave the following properties for the semi-triangular distribution:
- Mean = (1/3) a
- Variance = (1/18)a2.
- Second moment about the origin = (1/6) a2.
Following Kupperman’s publication in Biometrika, the distribution makes a few sparse entries in the literature afterwards. Entries tend to be of a bibliographical nature rather than a discussion of the formula or properties. For example, Kupperman’s article is mentioned in another publication by the National Bureau of Standards in 1970 [5].
Kupperman noted that grouping the range into a number of equal intervals “overstates the mean and understates the variance”, which may be one reason why the distribution never took off in a practical sense. Another reason may be that the “full” triangular distribution, from which the semi-triangular distribution was developed, has limited practical use—it is usually used when little information is known about outcomes except the most likely one (this creates the peak in the center of the distribution).
References
- Image: PAR~commonswiki . CC 3.0.
- Triangular, gamma, Erlang, Weibull distributions
- Haight, F. (1958). Index to the Distributions of Mathematical Statistics. National Bureau of Standards Report.
- Kupperman, M. On Exact Grouping Corrections to Moments and Cumulants. Biometrika 39, (pp. 429-434).
- National Bureau of Standards. An Author and Permuted Title Index to Selected Statistical Journals (1970). Special Publication 321. Online: https://books.google.com/books?id=uyIBpRKalmsC
What is a Triangular Distribution?
The triangular distribution, so named because of its triangular shape, is typically used when not much is known about the distribution of data, but the minimum, mode, and maximum can be estimated [2]. It is also used in discrete-event and Monte Carlo Simulation to model randomness.
In real life, this distribution can be used to estimate minimum and maximum values, the most likely outcomes — even if the mean and standard deviation are unknown. It can also model skewed distributions, such as a the sum of two dice. For example, the minimum roll (a) is 2, the maximum (b) is 12 and the peak (c) is at 7.
Triangular Distribution Parameters
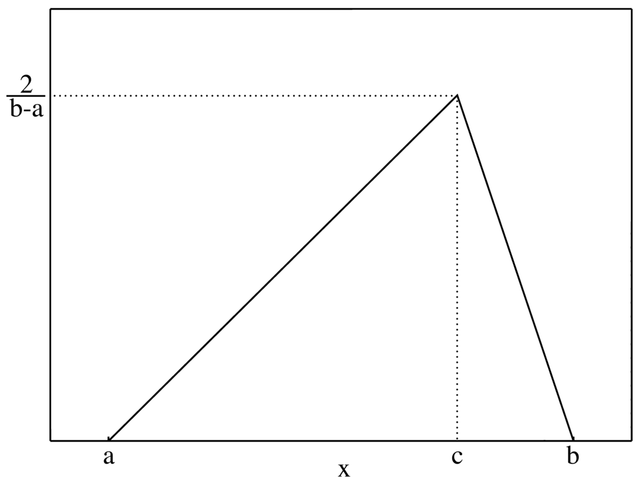
A triangular distribution (or triangle distribution) is a continuous probability distribution defined by three parameters:
- a: the minimum value, where a ≤ c,
- c: the peak value (the height of the triangle), where a ≤ c ≤ b,
- b: the maximum value, where b ≥ c.
This makes it very easy to estimate the distribution’s parameters from sample data:
- Use the sample minimum as an estimator for a,
- Use the sample maximum as an estimator for b, and
- Use any reasonable statistic (e.g. the sample mean, mode or median) as an estimator for c.
If you don’t have sample data, expert knowledge can be used to estimate a probable minimum, maximum and most likely value (i.e. the mode). The three parameters, a b and c change the shape of the triangle: 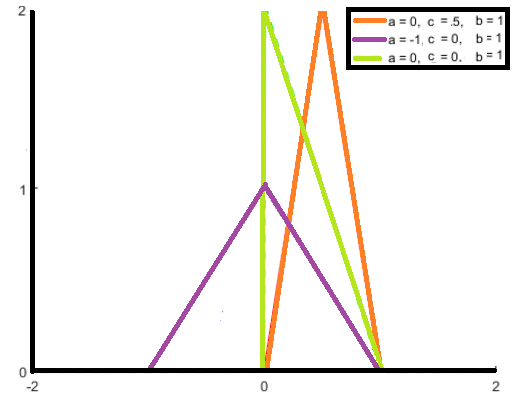
Like all probability distributions, the area under the curve is 1. Therefore, the wider the distance between a and c (i.e. the range ), the shorter the height. When the peak is centered at zero and a = b, it is called a symmetric triangular distribution. When this happens, a and b are equal but opposite in sign (e.g. -2, 2) and are sometimes referred to as -a and a instead of a and b. 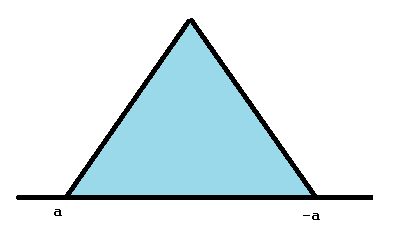
PDF, Mean and Standard Deviation
The probability density function (pdf), for the symmetric triangle distribution, used to find the probability a random variable falls into a certain range, is given by: 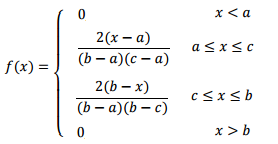
For non-symmetric distributions, the pdf can be estimated from sample data:
- a: Use the sample minimum,
- b: Use the sample maximum.
- c: Use the sample mean, mode or median.
- The mode is the value that appears most often in the sample data. This is often a “best guess.” With samples, it is necessary to use a histogram to estimate the mode of the underlying PDF, which can be tricky [1].
- The median is the value that divides the sample data into two equal halves: one of the right and one on the left.
- The mean is the average of the sample data.
You’ll want to avoid outliers because it can skew the parameter estimates. For example, one tiny outlier will result in the estimate for parameter a being too small.
The parameters can also be estimated by expert knowledge of likely values. For example, literature in your field might yield some estimated values. The mean for this distribution is: μ = 1/3 (a + b + c). The standard deviation, s, is: s = (1/√6) a. This formula makes the assumption that the distribution is centered at zero and that the endpoints are known.
Example question:
Voting for an election has close but the votes have not been counted. One candidate wants to find the probability that they received less than 450 votes. In other words, they want to find the probability p < 450. They guess that the minimum number of votes they received is 200, the maximum is 900 and the most likely scenario (the peak) is 550.
- Draw a triangular distribution with min = 200, max = 900 and peak at 550. Cut the distribution into two segments at 450 votes.
- Calculate the area of the triangle: The area of a triangle is 1/2 base * height.
- base = 450 – 200 = 250.
- height = f(450). Since 450 is between a = 200 and c = 550, this gives:
Which means the area is (base x height) = 1/2 x 250 x 0.0020408 = 0.2551 or 25.51%.
Relationship to the two-sided power distribution
The triangular distribution is a special case of the two sided power (TSP) distribution when n = 2. The probability density function (pdf) of the TSP distribution is
Where n is the shape parameter, a is the minimum and b is the maximum.
This reduces to the triangular pdf when n = 2.
Semi triangular distribution
Haight’s 1958 Index to the Distributions of Mathematical Statistics [3] lists the following formula for the semi-triangular distribution (p. 106):
For 0 ≤ x ≤a [3].
With grouping corrections:
The formula originated from an article by Kupperman in an article titled On Exact Grouping Corrections to Moments and Cumulants (pp. 429-434). Kupperman considered the effect of grouping on the mean and variance of a new twist on the rectangular distribution that he dubbed the “semi-triangular distribution”. This new distribution has a frequency curve shaped like the right half of the “regular” triangular distribution’s frequency curve.
Kupperman [4] gave the following properties for the semi-triangular distribution:
- Mean = (1/3) a
- Variance = (1/18)a2.
- Second moment about the origin = (1/6) a2.
Following Kupperman’s publication in Biometrika, the distribution makes a few sparse entries in the literature afterwards. Entries tend to be of a bibliographical nature rather than a discussion of the formula or properties. For example, Kupperman’s article is mentioned in another publication by the National Bureau of Standards in 1970 [5].
Kupperman noted that grouping the range into a number of equal intervals “overstates the mean and understates the variance”, which may be one reason why the distribution never took off in a practical sense. Another reason may be that the “full” triangular distribution, from which the semi-triangular distribution was developed, has limited practical use—it is usually used when little information is known about outcomes except the most likely one (this creates the peak in the center of the distribution).
References
- Image: PAR~commonswiki . CC 3.0.
- Triangular, gamma, Erlang, Weibull distributions
- Haight, F. (1958). Index to the Distributions of Mathematical Statistics. National Bureau of Standards Report.
- Kupperman, M. On Exact Grouping Corrections to Moments and Cumulants. Biometrika 39, (pp. 429-434).
- National Bureau of Standards. An Author and Permuted Title Index to Selected Statistical Journals (1970). Special Publication 321. Online: https://books.google.com/books?id=uyIBpRKalmsC