What is Wallenius’ distribution?
The Wallenius’ Distribution, more formally called the Wallenius’ noncentral hypergeometric distribution, is a distribution with biased sampling. It is usually described as an urn model without replacement and with bias. The distribution is named after Kenneth Ted Wallenius, who first described it in 1963 [1].General urn model vs. Wallenius’ distribution
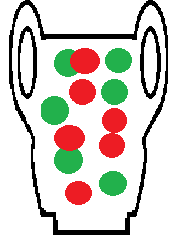 In a general urn model, a set of balls is placed into an urn, and the balls are removed one at a time without replacement. If the balls are identical, then the process is not biased and will follow a hypergeometric distribution. However, a biased urn model where the balls are different weights or sizes will affect the probability of an individual ball being chosen and will therefore produce a Wallenius’ Distribution.
An urn model that follows this distribution has the following characteristics:
- Items are chosen one by one from a fixed population of different items (e.g. 100 different colored balls).
- There are a fixed number of independent trials (e.g. balls to be chosen).
- Items are chosen randomly and without replacement.
- The probability of picking any particular item is equal to its fraction of the total weight or volume of all the items. In other words, a heavier or bigger ball will have a higher probability of being picked.
- The bias of an ball (e.g. its weight or volume) depends only on its color. In other words, all blue balls weigh the same, all red balls weigh the same, all green balls weigh the same etc.
Other uses for the Wallenius distribution
Not all examples of Wallenius distribution involve urns, although all play on the theme of choosing items from a group.- Biased sampling: For example, you are picking 50 crickets with a pair of large tweezers, one at a time, from a small cage filled with green, black and white crickets. The green crickets are the largest, followed by the black and then the white crickets. As the green crickets are larger, they have a higher probability of being chosen. The distribution of types of crickets caught will equal the Wallenius’ noncentral hypergeometric distribution.
- Estimating the count of survivors in competitive settings: For example, you could use it to find out which species might survive within a specific habitat or the which individuals might survive an outbreak of a disease [2].
- Assessing the quantity of errors in a sequence of dependent trials: For example, it could be used to assess errors made by students during tests or the production line errors committed by workers.
- Calculating the number of successful outcomes in a series of dependent experiments: For example, it could be used to find the effectiveness of a drug in curing a disease or the success rate of a new product in the market.
Disadvantages
The distribution is generally regarded as inefficient and numerically unstable. In addition, calculating probabilities and moments can be computationally intensive, especially for large sample sizes or populations. This can limit its usefulness, although the advent of modern computational tools has resulted in some renewed interest in the distribution’s properties [e.g., 3]. Outside of modeling theoretical biased sampling scenarios, it is only applicable to a few, very narrow areas like:- Selective predation and survival in ecology and evolutionary biology,
- Vaccine efficacy.
Other distributions
A related distribution is Fisher’s noncentral hypergeometric distribution, which uses the same urn model except that the balls are taken independently from each other. A set of balls can be taken at the same time, while in the Wallenius’ model, balls are taken one by one.References
- Wallenius, K. T. (1963). Biased Sampling: The Non-central Hypergeometric Probability Distribution. Ph.D. Thesis (Thesis). Stanford University, Department of Statistics.
- Manly, B. F. J. (1985). The Statistics of Natural Selection on Animal Populations. London.
- Martens, D. & Foster, P. (2013). Wallenius Naive Bayes. Retrieved September 19, 2023 from: https://archive.nyu.edu/handle/2451/33545?mode=full