Contents:
What are Monotonic Sequences and Series?
Watch the video or read on below:
A monotonic (monotone) sequence or monotone series, is always either steadily increasing or steadily decreasing.
More formally, a series {an} is monotonic if either:
- ai + 1 ≥ 1 for every i ≥ 1
- ai + 1 ≤ 1 for every i ≥ 1
If the first is true, the series is monotonically increasing.
If the second is true, it is monotonically decreasing.
Monotonic Sequence: Examples
One example of a monotonically increasing series is the series where an equals

We can tell that this series is steadily increasing if we let an be represented by a function f(n). Then we will want to take that function’s derivative, and get

The square in this equation means that it is positive everywhere. This tells us the function is an increasing function, so as n increases an will always increase.
Cautions About Identifying Monotonic Sequences
It’s very important not to just evaluate a few terms and make judgments on whether a sequence is monotonic based on those evaluations. Some sequences seem to increase or decrease steadily for a definite amount of terms, and then suddenly change directions. A sequence may increase for half a million terms, then decrease; such a sequence is not monotonic.
If {an} is both a bounded sequence and a monotonic sequence, we know it is convergent. If {an} is convergent, though, it may or may not be monotonic. There are some convergent series which change direction frequently as they approach a point in an oscillating manner from different sides.
Monotonic Functions
Monotonic functions are always headed in one direction: up or down, never reversing direction.
- A monotonically (strictly) increasing function (also called strictly increasing) is always headed up; As x increases in the positive direction, so does f(x).
- A monotonically decreasing function (also called strictly decreasing) is always headed down; As x increases in the positive direction, f(x) decreases.

Determining if a Function is Monotonically Increasing or Decreasing
A monotonically increasing function has a positive derivative (slope) for all points. The reverse is true for monotonically decreasing functions; The derivative is negative at all points. Therefore, if you can figure out what the derivative is doing, you can classify a function as either monotone increasing or monotone decreasing.

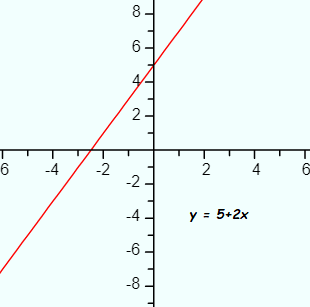
The above graph shows the function y = 5 + 2x. The graph gives us a visual confirmation that the function is most probably monotone increasing . However, we can’t see any end behavior on this particular graph, so we can’t say for sure that a function is monotonic just by eyeballing a graph. A sure way is to look at the derivative. For this particular function, the derivative (using the power rule) is
y’ = x2
The function is monotone increasing because the derivative is positive at all points in the domain. That is, because:

Strictly Monotonic
A strictly monotonic function either increases or decreases steadily as x increases from point a to point b. The difference between strictly monotone and plain old “monotone” is that a monotonic function can have areas where the graph flattens out (i.e. where the derivative is zero). A strictly monotonic function cannot have parts of the function that remain constant; the graph must always be increasing, or decreasing, for every single point in the domain.
Monotonic Functions and Discontinuities
Although a monotonic function can have areas where the graph stays constant, there are no discontinuities of the second kind and the function is continuous at “almost all” points across its domain (Houshang, 2003).
Monotonic Relationship
A monotonic relationships is where:
- One variable increases and the other increases. Or,
- One variable decreases and the other decreases.
While a monotonic function has to meet some strict requirements (e.g. it has to be a function), a monotone relationship is more general. It’s a description of a trend, and so is more commonplace in regression or trend analysis in statistics.

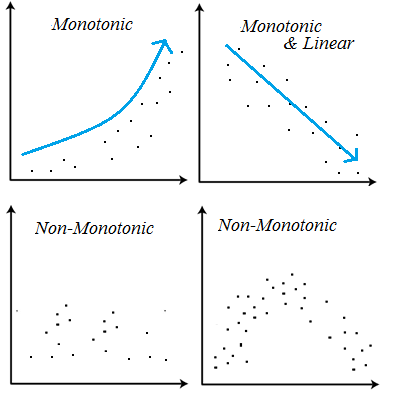
This increase (or decrease) doesn’t have to happen at the same rate. For example, the data in the image b above is monotone and linear. Linear relationships are monotonic, but not all monotone relationships are linear (as shown in image a).
- Monotonic variables increase (or decrease) in the same direction, but not always at the same rate.
- Linear variables increase (or decrease) in the same direction at the same rate.
If an increase in the independent variable causes a decrease in the dependent variable (image b), this is called a monotonic inverse relationship. An inverse relationship is the same thing as a negative correlation. A monotonic direct relationship is where an increase in the independent variable causes an increase in the dependent variable (image a). In other words, there’s a positive correlation between the data.
Tests
Before running a test, you should make a scatter plot first to view the overall pattern of your data.
The strength and direction of a monotonic relationship between two variables can be measured by the Spearman Rank-Order Correlation. If your variables are monotone and linear, a more appropriate test might be Pearson’s Correlation as long as the assumptions for Pearson’s are met. For example, if your data is highly skewed, has high kurtosis, or is heteroscedastic, you cannot use Pearson’s. You can, however, still use Spearman’s, which is a non-parametric test.
Values for Spearman’s range from -1 to 1, where:
- +1 = a perfect monotone increasing relationship.
- -1 = a perfect monotone decreasing relationship.
- 0 = not monotone.
As correlation is an measure of association, you can also think of the results in terms of effect size:
- .00-.19: very weak.
- .20-.39: weak.
- .40-.59: moderate.
- .60-.79: strong.
- .80-1.0: very strong.
References
Dadkhah, K. (2011). Foundations of Mathematical and Computational Economics. Springer Science and Business Media.
Jeffrey, A. Mathematics for Engineers and Scientists, 5th Edition. Mathematics for Engineers and Scientists, 5th Edition. CRC Press.
Houshang, S. (2003). Basic Real Analysis. Springer Science and Business Media.
O’Connor, John. Sequences. A First Analysis Course. Math Lecture Notes. University of St. Andrews, Scotland. http://www-history.mcs.st-and.ac.uk/~john/analysis/Lectures/L8.html on June 27, 2019