Independent and Dependent Variable: Contents (Click to skip to that section):
Other Types of Variables used in Calculus:
Independent Variable: Definition

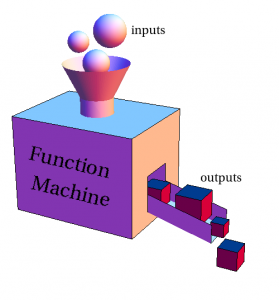
Independent variables are the “inputs” for functions. The value of an independent variable does not depend on other variables. Rather, changes in the independent variable (which take place in our “function machine”) cause a change in another variable (the dependent variable). A variable is simply something that we are trying to measure.
Identifying Independent Variables in Equations
Most times you see an equation, the dependent variable will be isolated on one side. The independent variable is usually designated by x. The dependent variable is typically designated by y. However, any variables could be used in place of x or y. In the equation below the dependent variable is y:

The independent variable is x. The value of y will change depending on the value of x. For instance, suppose x were 4:
y = 5(4) + 6
y = 26
If x was 6, the value of the dependent variable (y) would change:
y = 5(6) + 6
y = 36
By changing the values of the independent variable from 4 to 6 we caused a change in the dependent variable.
Independent Variables and Graphs
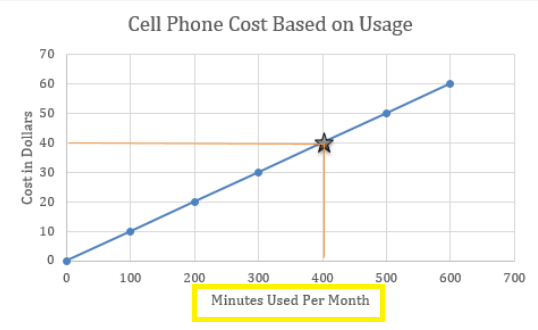
When working with graphs the independent variable will always be located on the x-axis. On the graph below, the independent variable (minutes used per month), is located on the x-axis.

The graph tells us is that the independent variable (minutes used per month) causes a change in the dependent variable (cost in dollars).
The use of the terms “independent” and “dependent” only show us a relationship between the stated variables; It’s not stating that the independent variable is never influenced by any outside variables. In this example, we’re only interested in how cost is influenced by minutes used. However, your minutes used might go up and down depending on who you’re dating, how many friends you have, or whether great aunt Zelda is sick. But we aren’t interested in any of those “other” variable here, we’re only comparing how minutes and cost interact.
Dependent Variable Definition (Functions/Calculus).
A dependent variable is a variable that depends on one or more other variables. In calculus, the dependent variable is the output of a function.
If you are given a simple formula, like y = x3, then y is a function of x (you can also say that “y depends on x.”
- x is the independent variable.
- y is the dependent variable.
The dependent variables are the output. For example, if x = 2, y = 23 = 2 * 2 * 2 = 8. In this example, 2 is the independent variable (graphed on the x-axis) and 8 is the dependent variable (graphed on the y axis).
These types of variables are useful for the study of derivatives. Usually in calculus we talk about incremental changes in the independent and dependent variable (Δx or Δy). The equation y = x3 becomes:
Δy = f(x3 + Δx) – Δx3 – f(x).
Geometrically, the equation defines the independent variable (Δx3) along the curve of the change Δx in x.
Identifying Dependent Variables in Equations
The dependent variable of an equation is fairly easy to identify. It will be the variable in the equation that has its value determined by the values given to the other variables. Let’s take a look at an example of an equation and identify the dependent variable.
y = 5x + 6
The dependent variable is y. The value of y depends on the value that we choose for x. x in this equation is the independent variable.
Dependent Variables and Graphs
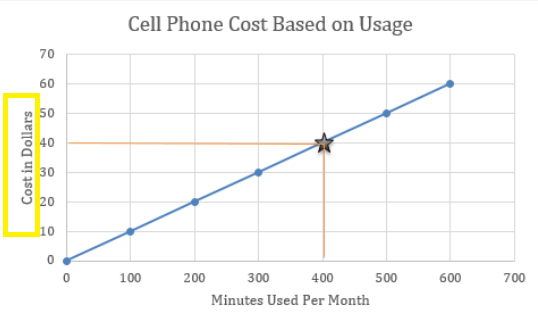
When working with graphs the dependent variable will always be located on the y-axis. Notice on the graph below that the dependent variable, cost in dollars, is located on the y-axis.

The graph tells us is that the dependent variable (cost in dollars) is dependent on the number of minutes used per month. The number of minutes used per month is the independent variable, which is located on the x-axis.
Categorical Variables
Categorical variables (perhaps not surprisingly) fall into a particular category. College major, political affiliation, or sexual orientation are all categories. The variables in those categories are called “categorical variables”.
For example:
- Category “college major”: Math, English, Geology.
- Category “eye color”: Blue, Brown, Green.
“College major” and “eye” color are the categories and are not categorical variables. The variables are within those categories and they are usually specific pieces of information that you want to input. They may come from an experiment or a survey. For example, let’s say you survey people and ask them for their horoscope sign. They would give you a categorical variable: Aquarius, Pisces, Leo. They wouldn’t respond “horoscope sign.”
There is no order to categorical variables. For example, you can’t order “blue, brown, and green”. If there is some kind of order, those variables would be ordinal variables instead. For example, you might categorize television prices by cheap, moderate and expensive.
Quantitative Variables
Quantitative variables are the “x” and “y” of calculus: you can generally work with them mathematically (for example, you can add them). Categorical variables can describe those numbers.
Contents:
- What is a Quantitative Variable?
- Difference Between Quantitative Variable and Qualitative Variable
- Quantitative and Qualitative Calculus
What is a Quantitative Variable?
Quantitative variables can be counted or measured. You can think of them as numeric variables, and they usually answer questions like:
- How many?
- How much?
- How often?
Quantitative variables include things like age, height, or time to completion.
If a variable isn’t quantitative, then it’s qualitative. These are values you don’t find by measuring or counting. They describe characteristics like fur color, gender, location or profession.
The same object or unit can be described with both quantitative and qualitative variables. For example, a person can be described as 34 years old, with 4 children, and 6 feet tall, (all quantitative variables); but also as Dutch, a good cook, and a basketball player (qualitative variables).
Types of Quantitative Variable
We can divide all quantitative variables into two main subsets: continuous variables and discrete variables.
- Discrete variables have a value from a set of discrete whole values. The number of cars at the parking lot, the number of children in a classroom, or a number of business locations are all examples of discrete variables.
- Continuous variables take values from an interval and can take values at any point on that interval. A continuous variable has as many significant digits as the instrument you use to measure it allows. Temperature is an example of a continuous variable; you can have water at 25 degrees Celsius, but you can also have water at or 24.998 or 25.0004 degrees Celsius.

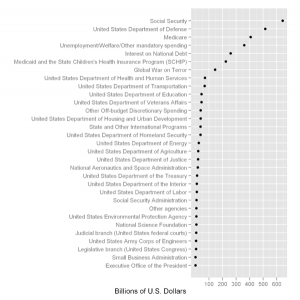
In this graph, categorical variables are shown on the y-axis and quantitative data on the x-axis.
Difference Between Quantitative or Qualitative Variables
Watch the video, or read the article below:
Quantitative means you can count it, like “number of corn fields in a square mile.” Qualitative means you can describe it, like “black fur on a cat.” A standard Deck of playing cards has both types of variable; The numbers on the cards (2 through 9) are quantitative, and the suits (Clubs, Diamonds, Hearts, Spades) are qualitative variables.

A simple way of looking at the differences:
- If it can be added, it’s quantitative.
- If you can’t add it, it’s qualitative.
For example:
- Horse + pony + saddle = ?
- Skin tone + eye color = ?
You could give numerical values to the qualitative variables so that you can add them. For example,
- Horse = 1
- Pony = 2
- Saddle = 3
Assigning a number doesn’t make them quantitative variables, but they do allow you to perform calculations.
Quantitative vs Qualitative?
If you aren’t sure what category your variables fall into (qualitative or quantitative), try this simple method to figure it our:
Step 1: Give the items in your set a category like “hair color” or “types of rice” or “clothing colors”. The name of the category is not important.
Step 2: Order the items in your category. Anything with numbers (like rolls of money, grade point averages, or car years) can be ordered. If you find this impossible, then you have a qualitative item.
Step 3: Make sure you haven’t added extra information. For example, you could rank shoe brands by popularity or how much they cost, but popularity and cost are separate from “make of shoe.” If the item is “shoes,” it’s qualitative. If the item is “cost of shoes,” it’s quantitative.
2. Quantitative vs Qualitative Calculus
Calculus is usually defined as the quantitative study of change, using traditional algebraic methods, proportions, and ratios. However, many authors (including Piaget, 1946:1970; Nemirovsky, Tierney & Ogonowski, 1993; Kaput, 1994; Stroup, 2002; Confrey &
Smith, 1995 as cited in Jerde & Wilensky, 2010) have described “qualitative calculus” as understanding and reasoning about rates of change and accumulation without the traditional mathematical underpinnings.
Assigning Quantities
You can code a categorical variable to make it look like a quantitative one. For example, you could code eye color as 1:blue, 2:brown, 3: green or 4:hazel. Although this can be useful for data analysis, it doesn’t become a quantitative variable because you assigned it a number.
References
What Can we do with Qualitative Calculus Today?
Dodge, Y.; Cox, D.; Commenges, D.; Davidson, A; Solomon, P.; and Wilson, S. (Eds.). The Oxford Dictionary of Statistical Terms, 6th ed. New York: Oxford University Press, 2006.
Jerde, M. & Wilensky, W. Qualitative Calculus of Systems: Exploring Students’ Understandings of Rate of Change and Accumulation in Multiagent Systems.
Gurney, D. Math 241 Course Notes. Qualitative Versus Quantitative. Retrieved from https://www2.southeastern.edu/Academics/Faculty/dgurney/Math241/StatTopics/QualVsQuant.htm on September 12, 2019
Australian Bureau of Statistics. Statistical Language- Quantitative and Qualitative Data. Retrieved from https://www.abs.gov.au/websitedbs/a3121120.nsf/home/statistical+language+-+quantitative+and+qualitative+data on September 13, 2019
Australian Bureau of Statistics. Statistical Language— What are VAriables? Retrieved from
https://www.abs.gov.au/websitedbs/a3121120.nsf/home/statistical+language+-+what+are+variables on September 13, 2019
West Virginia University. Lesson 5:
Expressing the Relationship between Independent and Dependent Variable Retrieved January 17, 2019 from http://nextgen.wvnet.edu/Courses/lesson.php?c=8&u=51&l=325&t=Lesson