Spearman Rank Correlation / Spearman’s Rho
What is Spearman Rank Correlation / Spearman’s Rho?
The Spearman rank correlation coefficient, rs, is the nonparametric version of the Pearson correlation coefficient.
Assumptions for Spearman’s Rank Correlation
Your data must be ordinal, interval or ratio.
In addition, because Spearman’s measures the strength of a monotonic relationship, your data has to be monotonically related. Basically, this means that if one variable increases (or decreases), the other variable also increases (or decreases).
Test Results
Spearman’s returns a value from -1 to 1, where:
+1 = a perfect positive correlation between ranks
-1 = a perfect negative correlation between ranks
0 = no correlation between ranks.
Contents:
Spearman Rank Correlation: Worked Example (No Tied Ranks)
Watch the video for a guided example on the spearman correlation by hand, or read on below.

Can’t see the video? Click here to watch it on YouTube.
The formula for the Spearman rank correlation coefficient when there are no tied ranks is:
![]()
Example Question:
The scores for nine students in physics and math are as follows:
- Physics: 35, 23, 47, 17, 10, 43, 9, 6, 28
- Mathematics: 30, 33, 45, 23, 8, 49, 12, 4, 31
Compute the student’s ranks in the two subjects and compute the Spearman rank correlation.
Step 1: Find the ranks for each individual subject. I used the Excel rank function to find the ranks. If you want to rank by hand, order the scores from greatest to smallest; assign the rank 1 to the highest score, 2 to the next highest and so on:
![]()
Step 2: Add a third column, d, to your data. The d is the difference between ranks. For example, the first student’s physics rank is 3 and math rank is 5, so the difference is 2 points. In a fourth column, square your d values.
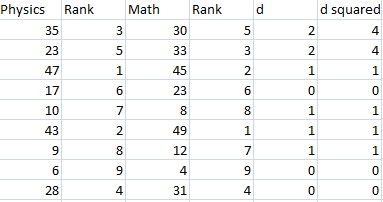
Step 3: Sum (add up) all of your d-squared values.
4 + 4 + 1 + 0 + 1 + 1 + 1 + 0 + 0 = 12. You’ll need this for the formula (the Σ d2 is just “the sum of d-squared values”).
Step 5: Insert the values into the formula. These ranks are not tied, so use the first formula:
![]()
= 1 – (6*12)/(9(81-1))
= 1 – 72/720
= 1-0.1
= 0.9
The Spearman Rank Correlation for this set of data is 0.9.
Spearman Rank Correlation: What to do with Tied Ranks
Tied ranks are where two items in a column have the same rank. Let’s say two items in the above example tied for ranks 5 and 6. The following image shows each tied data point assigned a mean rank of 5.5:
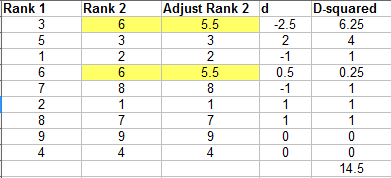
When this happens, you have a couple of options. You could also use the easier formula for tied ranks *if* you only have one or two tied ranks here and there. The image above shows the workings for the ties and the d-squared values you’ll need to input into the simple version of the formula above. However, that option may leave you with little confidence in any p-values you produce (Kinnear and Gray, 1999). A better option may be to calculate correlation with another method, like Kendall’s Tau.
Another option is simply to use the full version of Spearman’s formula (actually a slightly modified Pearson’s r), which will deal with tied ranks:
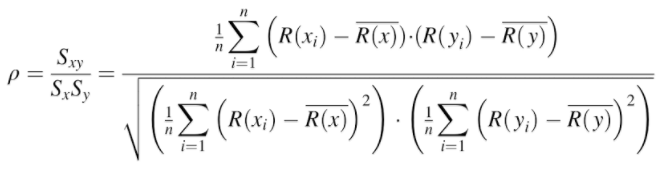
Where:
- R(x) and R(y) are the ranks,
- R(x)bar and R(y)bar are the mean ranks.
Check out our YouTube channel for hundreds of statistics help videos!
References
Clef, T. (2013). Exploratory Data Analysis in Business and Economics: An Introduction Using SPSS, Stata, and Excel. Springer Science and Business Media.
Kinnear and Gray (1999). SPSS for Windows Made Simple. Taylor and Francis.
Rees, D. (2000). Essential Statistics. CRC Press.