< Probability distributions < Parametric and non-parametric distributions
What are parametric and non-parametric distributions?
Two distinct types of probability distributions are found in probability: parametric and non-parametric distributions. These differ in their approach to data modeling:
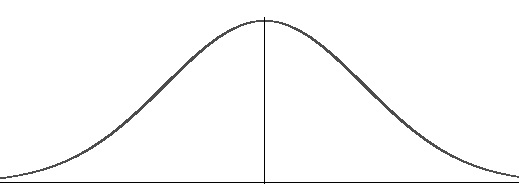
- Parametric distributions are characterized by a collection of parameters that outline the distribution’s shape. For example, the normal distribution, a type of parametric distribution, is shaped by two parameters: the mean (μ) and the standard deviation (σ). The mean determines the location of the distribution (for example, centered at x = 0), while the standard deviation tells us about how far the distribution is spread out.
- Non-parametric distributions lack specific parameters and make few (or no) assumptions about which distribution the data may have came from. The distribution’s shape isn’t pre-determined but rather estimated based on data. Examples include histograms and kernel density estimators.
Reliability of parametric and non-parametric distributions
Typically, non-parametric distributions are more reliable and adaptable for modeling distributions. Changes to a model’s parameters also result in more predictable changes in the distribution’s shape and range.
One reason for the utility of parametric distributions is that the same equation is used each time a parametric model is created; Every parametric distribution is constructed around a mathematical function called a probability density function (pdf), with parameters that define the spread of the distribution and location of the distribution’s center.
On the other hand, non-parametric distributions have their spread and central location defined by the data and a pdf may be used to describe the distribution’s shape (if the data closely follows a known probability distribution).
Parametric distributions are often preferred and there’s one for just about every situation in statistics you could possibly hope to come across, from urn models to transformations of existing probability distributions. But, there are some reasons why non-parametric distributions might be used instead.
For example:
Sometimes, an expert might be knowledgeable about parameters that define a particular probability distribution. For example, a biochemist may routinely determine the standard error of a chemical concentration in a set of samples — without actually using a pdf. In addition, they may known their data so well (i.e., if they have performed thousands of trials with similar data) that they can make a well-informed guesstimate of the sample’s parameters. Forcing the data onto a parametric distribution would complicate matters and not add anything to the biochemist’s understanding of the data.
However, using parametric distributions for modeling comes with its own set of challenges, For example, while a statistician might understand the intricacies of a certain parametric probability distribution, a layperson — such as the reader of a health journal — may not. Also, it’s challenging to get the exact shape right when using parametric distributions to model data, because small changes in data can cause big shifts in distributions that aren’t always obvious.
What are parametric and non-parametric tests?
A parametric test makes assumptions about population parameters and the specific parametric distribution data came from. Tests such as Student’s T tests and ANOVA tests, which assume data comes from a normal distribution, fall into this category.
On the other hand, a nonparametric test makes no assumptions about population parameters. Examples of nonparametric tests include chi-square, Fisher’s exact , and the Mann-Whitney test.
Each parametric test has a nonparametric counterpart. For instance, if you have parametric data from two independent groups, an independent samples t-test can be performed to compare means. However, if your data is nonparametric, a Mann Whitney test could be conducted instead.
Non-parametric vs. distribution free
Distribution-free is often used as a synonym for non-parametric. However, there is a subtle difference: distribution-free methods make no assumptions about which probability distribution data came from when comparing means from two populations and drawing inferences from samples, such as comparing sample means. In contrast, non-parametric distributions disregard population means or other parameter and use methods such as rank comparisons instead. The distinction between the two terms is subtle, often situation-specific and frequently blurred. So, many authors use the terms interchangeably [1].
References
- Marascuilo et al. (1977) Nonparametric and distribution-free methods for the social sciences. Brooks/Cole Publishing Co.